Figures & data
Figure 1 Study design (JSWOG-C2).
Abbreviations: CAPOX, capecitabine and oxaliplatin; CTCAE, Common Terminology Criteria for Adverse Events version 4.0; FOLFOX, folinic acid, fluorouracil, and oxaliplatin; LV, leucovorin; M, months; mFOLFOX6, modified FOLFOX; OX, Oxaliplatin; PNQ, Patient Neurotoxicity Questionnaire; q2w, every 2 weeks; JSWOG, Japan Southwest Oncology Group; L, optical isomer.
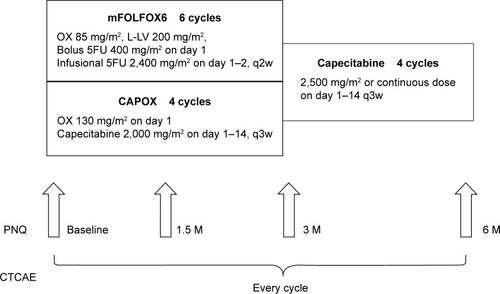
Figure 2 PNQ – oxaliplatin.
Abbreviation: PNQ, Patient Neurotoxicity Questionnaire.
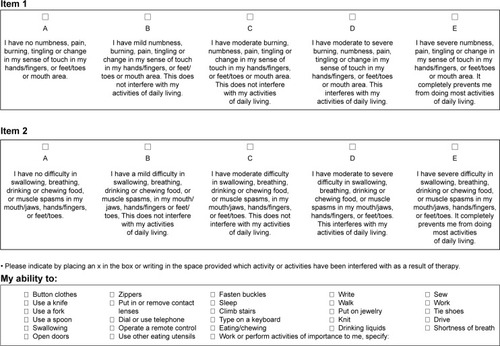
Table 1 Patient characteristics (N=86)
Figure 3 CONSORT diagram for this study.
Notes: In total, 91 patients from eleven hospitals were enrolled. Two patients were excluded for not fulfilling the eligibility criteria, and three were excluded for refusing to continue treatment.
Abbreviation: CONSORT, consolidated standards of reporting trials.
Abbreviation: CONSORT, consolidated standards of reporting trials.
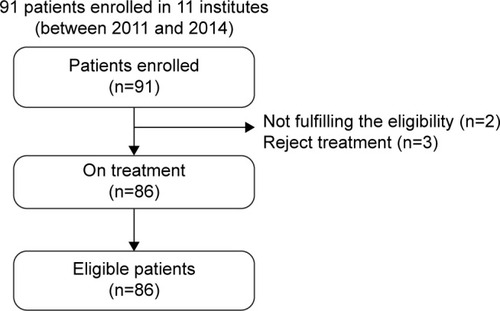
Table 2 Proportion of patients completing treatment and dose of oxaliplatin in the treatments
Table 3 Adverse events
Figure 4 Frequency of neurotoxicity at four points: baseline and months 1.5, 3, and 6 after induction of adjuvant chemotherapy.
Abbreviations: CTCAE, Common Terminology Criteria for Adverse Events version 4.0; M, months; PNQ, Patient Neurotoxicity Questionnaire.
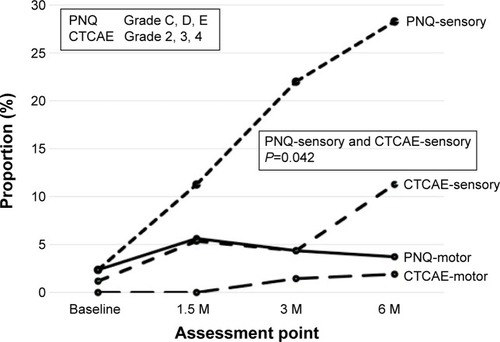
Table 4 Correlation between PNQ and CTCAE by Spearman’s correlation coefficient
Figure 5 PSN during oxaliplatin treatment and at month 6.
Abbreviation: PSN, peripheral sensory neuropathy.
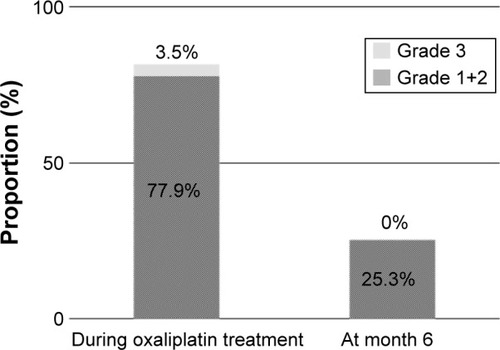
Figure 6 Changes in PNQ and CTCAE between PSN+ and PSN− groups at month 6.
Abbreviations: CTCAE, Common Terminology Criteria for Adverse Events version 4.0; M, months; PNQ, Patient Neurotoxicity Questionnaire; PSN, peripheral sensory neuropathy; ns, not significant.
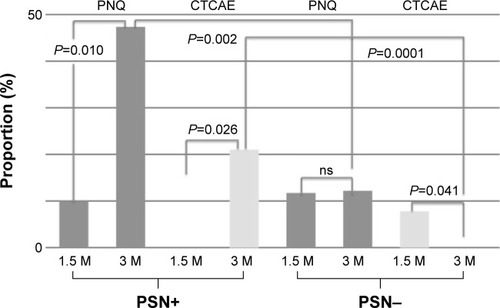
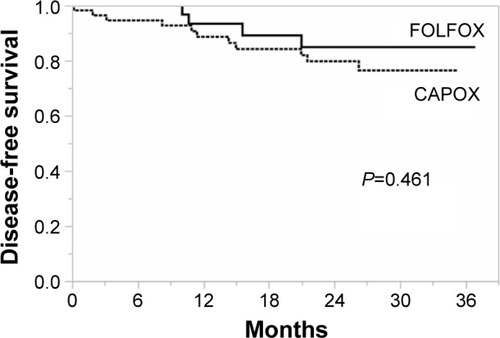
Figure 7 DFS.
Abbreviations: DFS, disease-free survival; CAPOX, capecitabine and oxaliplatin; FOLFOX, folinic acid, fluorouracil, and oxaliplatin.