
Figures & data
Table 1 Inclusion criteria according to risk factors and a 10-year risk assessment
Figure 1 Study flowchart.
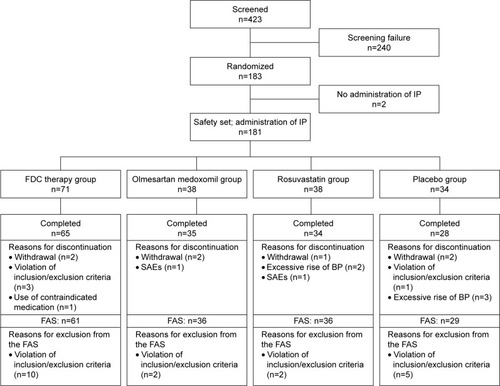
Table 2 Demographics and baseline characteristics prior to randomization in the full analysis set
Table 3 Changes in the low-density lipoprotein cholesterol level at weeks 4 and 8 in the full analysis set
Table 4 Least square mean percentage change from baseline in the total cholesterol, triglyceride and high-density lipoprotein cholesterol levels at weeks 4 and 8 in the full analysis set
Figure 2 Percentage of patients who achieved the treatment goals of low-density lipoprotein cholesterol levels and blood pressure at week 8 in the full analysis set.
Abbreviations: DBP, diastolic blood pressure; FDC, fixed-dose combination.
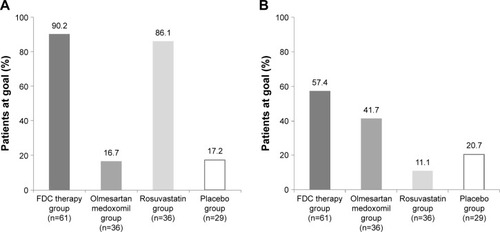
Table 5 Changes in blood pressure at weeks 4 and 8 in the full analysis set
Table 6 Summary of AEs and adverse drug reactions in the safety set
Table S1 Twenty-five participating institutions