
Figures & data
Table 1 Composition and characterization of MT-loaded niosomal formulations
Table 2 Composition of different MT fast dissolving films
Table 3 Physical and mechanical properties of MT fast dissolving films
Figure 1 DSC thermograms of (1) pure drug (MT), (2) pure polymer (MC), (3) physical mixture (drug and polymer), (4) MT niosomal film, (5) physical mixture (drug and span 60), (6) pure span 60, (7) pure cholesterol, and (8) physical mixture (drug and cholesterol).
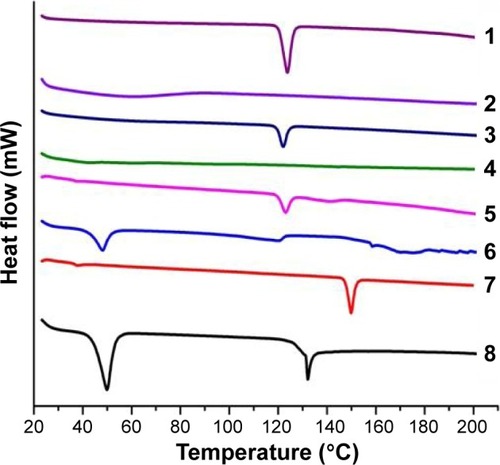
Figure 2 FTIR spectra of (1) pure drug (MT), (2) pure polymer (MC), (3) physical mixture (drug and polymer), (4) MT niosomal film, (5) physical mixture (drug and cholesterol), (6) physical mixture (drug and span 60), (7) pure cholesterol, and (8) pure span 60.
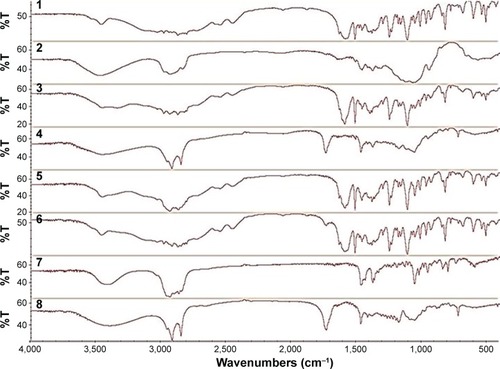
Figure 3 Cumulative MT release from conventional medicated fast dissolving film (F6) in comparison with its niosomal dispersion (N4).
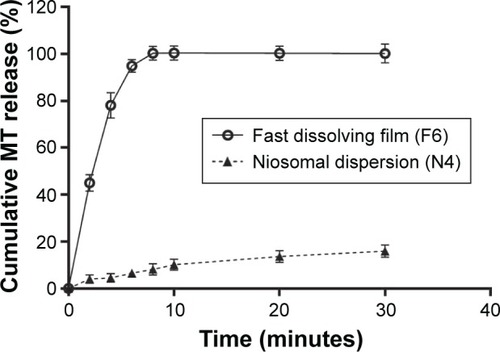
Figure 4 Cumulative MT release from niosomal fast dissolving film (N4F6) in comparison with its niosomal dispersion (N4).
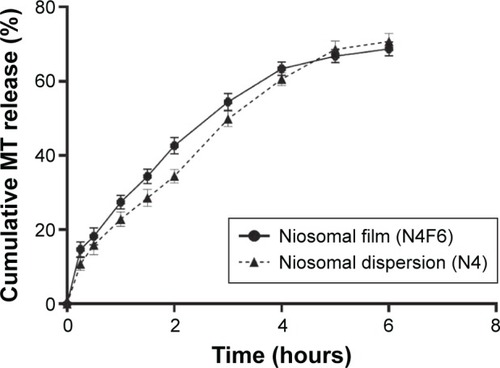
Table 4 Kinetics of MT release from niosomal film and dispersion according to different kinetic models
Table 5 Physicochemical evaluation of the selected fast dissolving film formulations during stability study
Figure 5 Surface morphology of the selected fast dissolving niosomal film and niosomal dispersion.
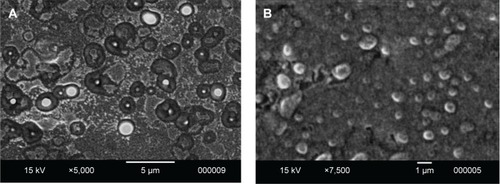
Figure 6 Plasma concentrations of MT after sublingual and oral administration.
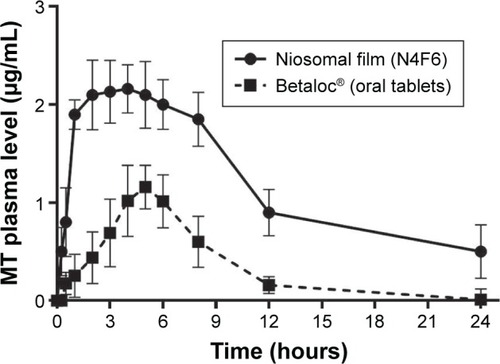
Table 6 Pharmacokinetic parameters of MT in plasma after sublingual administration of fast dissolving niosomal film compared to commercial oral tablets