Figures & data
Figure 1 Erythrocyte deformability values of the groups.
Notes: *P<0.05 compared to the control group. Group I: intravenous ibuprofen-treated group; Group L: lornoxicam-treated group; and Group C: control group.
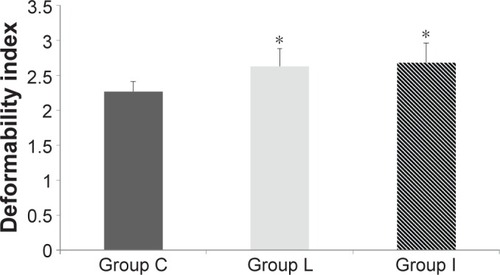
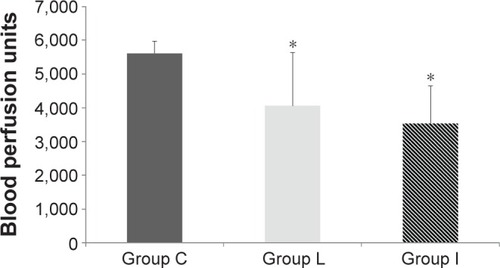
Figure 2 Distributions of liver blood flow measurements.
Notes: Measurements are represented in BPUs. *P<0.05 compared to the control group. Group I: intravenous ibuprofen-treated group; Group L: lornoxicam-treated group; and Group C: control group.
Abbreviation: BPU, blood perfusion unit.
Abbreviation: BPU, blood perfusion unit.
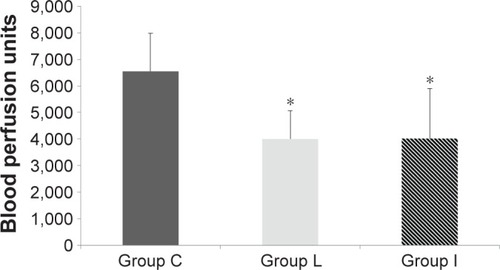
Figure 3 Distributions of renal blood flow measurements.
Notes: Measurements are represented in BPUs. *P<0.05 compared to the control group. Group I: intravenous ibuprofen-treated group; Group L: lornoxicam-treated group; and Group C: control group.
Abbreviation: BPU, blood perfusion unit.
Abbreviation: BPU, blood perfusion unit.