Figures & data
Table 1 Composition of 1,000 g of hydrophilic ointment containing 10% w/w seed powder of PC
Table 2 Factor combination as per chosen experimental design and translation of coded levels in actual units
Table 3 Phytochemical screening of powdered form of PC
Table 4 Rheological report of formulated ointment by rheometer
Figure 1 Effect of increased shear stress on viscosity of formulation.
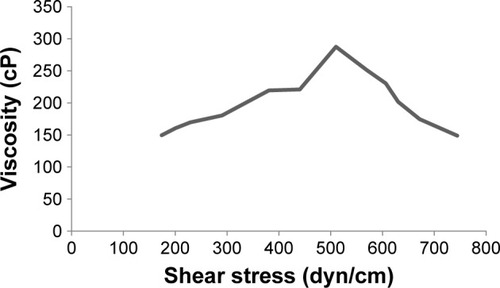
Figure 2 Response surface plot showing the influence of PG and OO on viscosity of formulation.
Note: X1 = A = PG and X2 = B = OO.
Abbreviations: PG, propylene glycol; OO, olive oil.
Abbreviations: PG, propylene glycol; OO, olive oil.
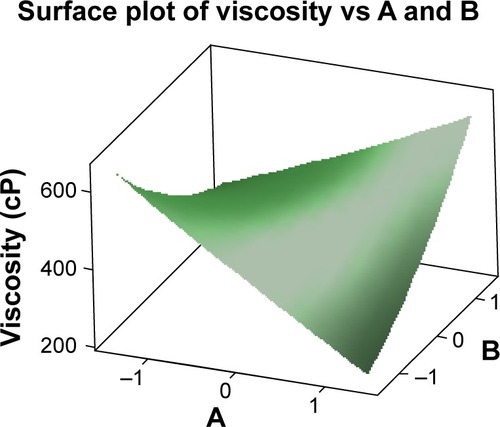
Figure 3 Contour plot showing the influence of PG and OO on viscosity of formulation.
Note: X1 = A = PG and X2 = B = OO.
Abbreviations: PG, propylene glycol; OO, olive oil.
Abbreviations: PG, propylene glycol; OO, olive oil.
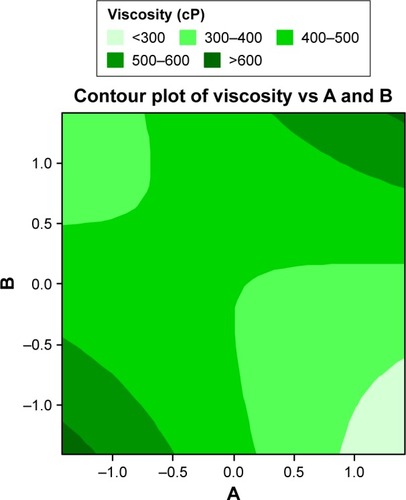
Figure 4 FTIR spectrum of powdered form of PC.
Abbreviations: FTIR, Fourier transform infrared spectroscopy; PC, Psoralea corylifolia.
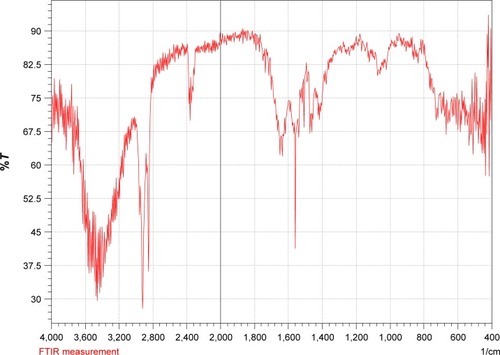
Figure 5 FTIR spectrum of formulation containing PC seed powder.
Abbreviations: FTIR, Fourier transform infrared spectroscopy; PC, Psoralea corylifolia.
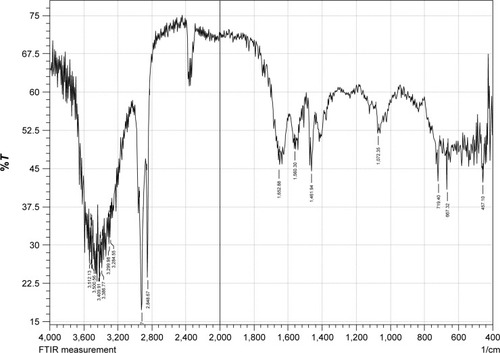
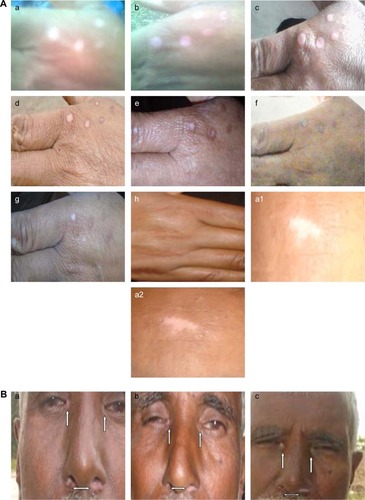
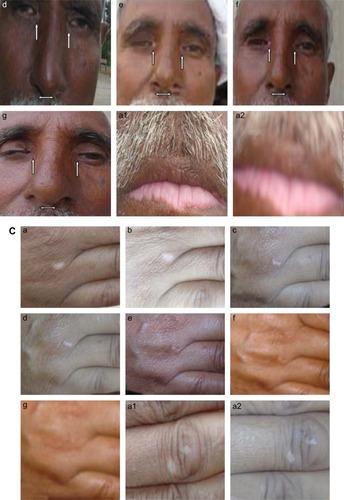
Figure 6 (A–C) Evolution of pigmentation.
Notes: Arrows were pointed toward the small circular white spots to elaborate the stepwise pigmentation of skin. (a) Before start of treatment; (b) after 12 days of start of treatment; (c) after 24 days of start of treatment; (d) after 36 days of start of treatment; (e) after 48 days of start of treatment; (f) after 60 days of start of treatment; (g) after 72 days of start of treatment; (h) small circular white patches of vitiligo into normal skin within 12 weeks of treatment; (a1) self-control before start of treatment; (a2) self-control after completion of treatment period.