Figures & data
Figure 1 Chemical structure of 20(R)-25-methoxyl-dammarane-3β, 12β, 20-triol.
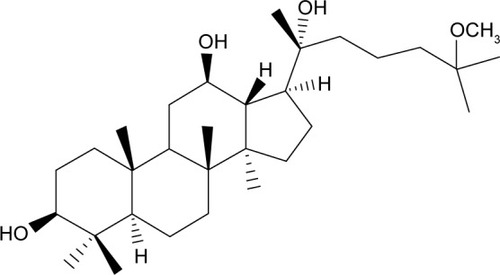
Figure 2 Differential scanning calorimetry thermograms of 25-OCH3-PPD (A), phospholipid (B), physical mixture (C), and complex (D).
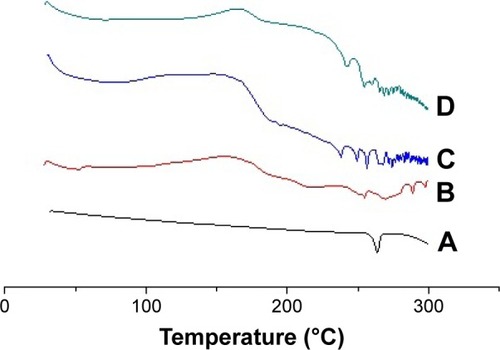
Figure 3 Scanning electron microscopic pictures of 25-OCH3-PPD (A), 25-OCH3-PPD-phospholipid complex (B), physical mixture (C), and phospholipid (D) at ×500 magnification.
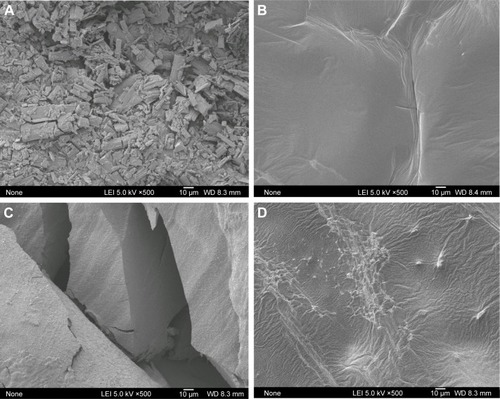
Figure 4 Infrared radiation of 25-OCH3-PPD (A), phospholipid (B), physical mixture (C), and complex (D).
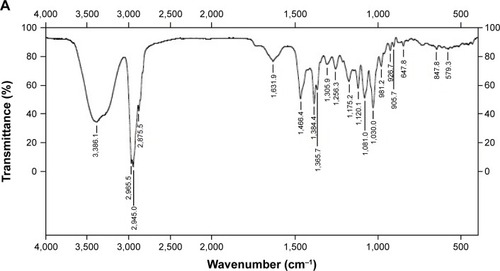
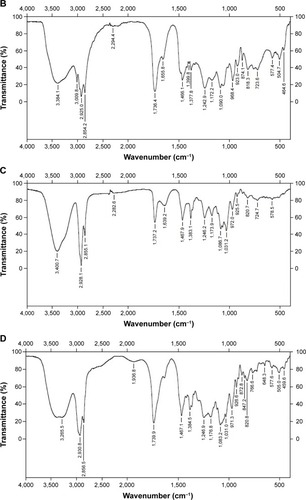
Table 1 Apparent solubility of 25-OCH3-PPD, physical mixture and complex in water and in n-octanol at room temperature
Figure 5 Product ion mass spectra of [M+H]+ ions. Product ion mass spectra of 25-OCH3-PPD (m/z 493.5 → 425.4) (A) and mifepristone (m/z 430.3 → 372.1) (B).
![Figure 5 Product ion mass spectra of [M+H]+ ions. Product ion mass spectra of 25-OCH3-PPD (m/z 493.5 → 425.4) (A) and mifepristone (m/z 430.3 → 372.1) (B).](/cms/asset/505c8db7-b979-49c1-b859-ca16c984d562/dddt_a_12173063_f0005_b.jpg)
Table 2 Pharmacokinetic parameters of 25-OCH3-PPD and complex in rats after oral administration
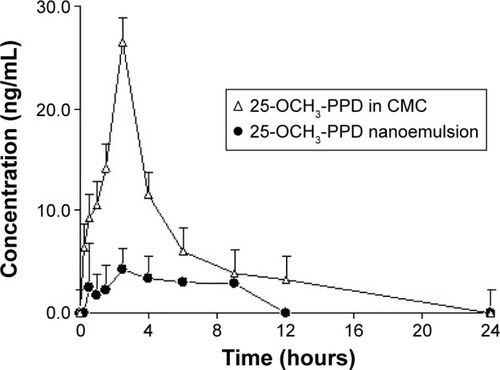
Figure 6 The plasma concentration–time curve of 25-OCH3-PPD in rats after the oral administration of 25-OCH3-PPD in Carboxyl methyl Cellulose (CMC) and the complex (20 mg/kg, 25-OCH3-PPD).
Abbreviation: SD, standard deviation.