
Figures & data
Figure 1 Chemical structure of methyl salicylate 2-O-β-d-lactoside.
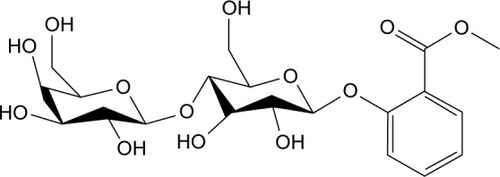
Figure 2 Sera of BALB/c mice in each group were collected every month after intravenous injection of pristane, and relative levels of the autoantibodies were detected by ELISA.
Abbreviations: ELISA, enzyme-linked immunosorbent assay; SEM, standard error of the mean; dsDNA, double-stranded DNA; MSL, methyl salicylate 2-O-β-d-lactoside.
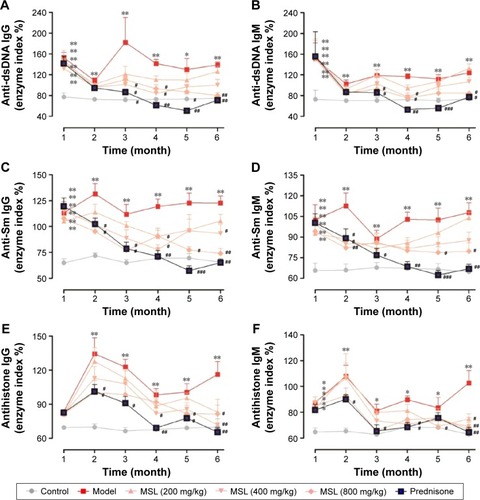
Figure 3 Total IgG and cytokines in peripheral circulatory system.
Abbreviations: ELISA, enzyme-linked immunosorbent assay; SEM, standard error of the mean; MSL, methyl salicylate 2-O-β-d-lactoside.
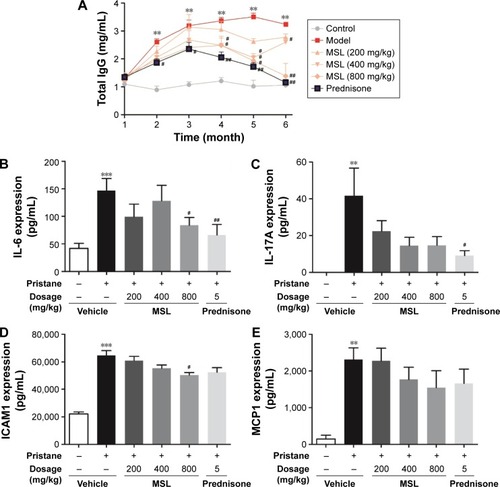
Figure 4 Behavioral experiments.
Abbreviations: SEM, standard error of the mean; MSL, methyl salicylate 2-O-β-d-lactoside; Rota, rotation.
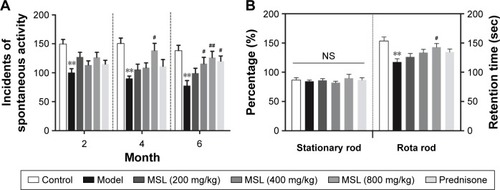
Figure 5 Splenomegaly and pathological examination.
Abbreviations: H&E, hematoxylin and eosin; mAb, monoclonal antibody; MSL, methyl salicylate 2-O-β-d-lactoside; SEM, standard error of the mean.
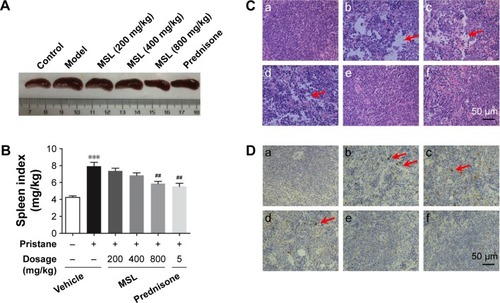
Figure 6 Progression of arthritis in BALB/c mice from each group.
Abbreviations: SEM, standard error of the mean; MSL, methyl salicylate 2-O-β-d-lactoside.
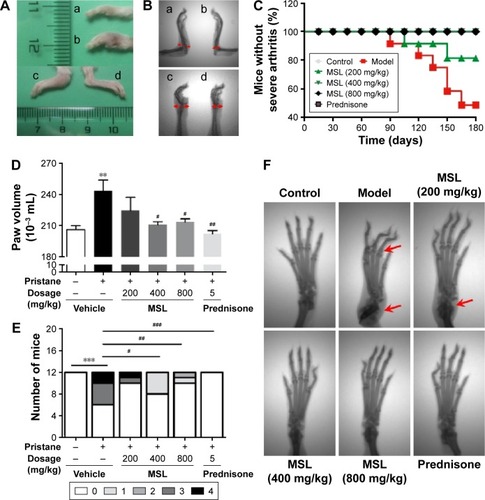
Figure 7 Examination for renal function and pathology.
Abbreviations: H&E, hematoxylin and eosin; PAS, periodic acid–Schiff; MSL, methyl salicylate 2-O-β-d-lactoside; DAPI, 4′,6-diamidino-2-phenylindole; SEM, standard error of the mean.
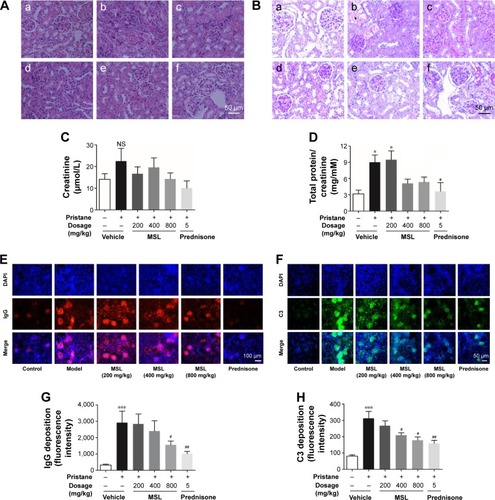
Figure 8 Relative expression levels of TNFα (A), IL-6 (B), IL-17A (C), and MCP1 (D) in renal tissues were detected by ELISA.
Abbreviations: ELISA, enzyme-linked immunosorbent assay; SEM, standard error of the mean; MSL, methyl salicylate 2-O-β-d-lactoside.
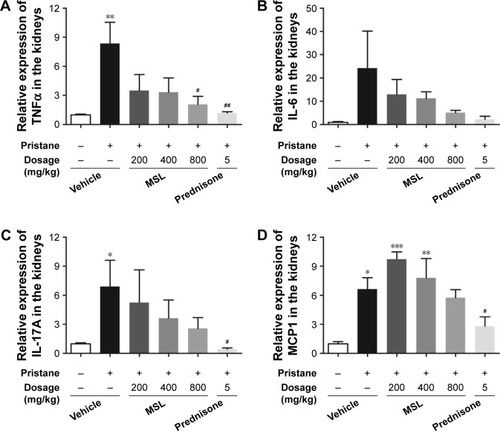
Figure 9 Inflammatory pathway in renal tissues of the BALB/c mice in each group.
Abbreviations: SEM, standard error of the mean; MSL, methyl salicylate 2-O-β-d-lactoside.
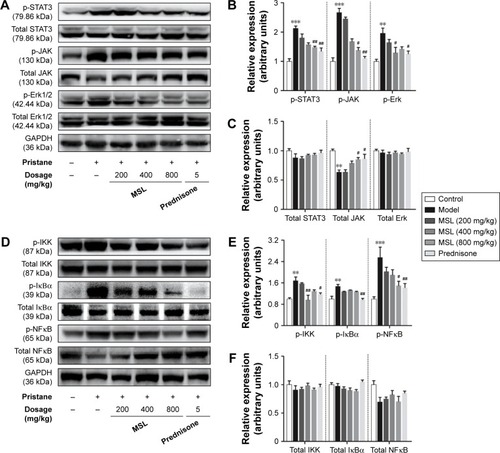
Table S1 The information regarding the main antibodies used in this study