
Figures & data
Figure 1 Chemical structure of albuterol sulfate with the protonated nitrogen atom.
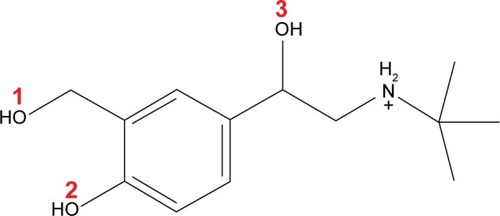
Figure 2 The MD process of AS–BSA complexes.
Abbreviations: MD, molecular dynamics; AS, albuterol sulfate; BSA, bovine serum albumin; RMSD, root-mean-square-deviation; Rg, radius of gyration; VDW, van der Waals; CPK, Corey–Pauling–Koltun.
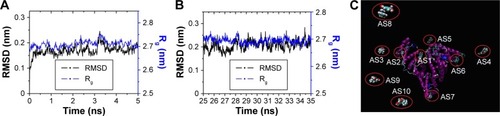
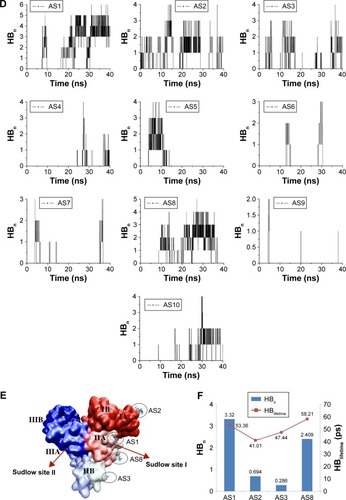
Table 1 Comparison of binding energy (kJ/mol) between major AS-binding sites on BSA
Table 2 Hydrogen-bond analysis in terms of presence and average distance
Figure 3 Critical site interactions of AS1 with BSA.
Abbreviations: AS, albuterol sulfate (numbered 1 when adding ten albuterol sulfate molecules into the cubic box randomly); BSA, bovine serum albumin; MD, molecular dynamics; DA, donor–acceptor; CPK, Corey–Pauling–Koltun; Lys, lysine; Glu, glutamate; Asp, aspartate; W, water.
Figure 4 SPR dose–response sensorgrams of AS with immobilized BSA.
Abbreviations: SPR, surface plasmon resonance; AS, albuterol sulfate; BSA, bovine serum albumin.
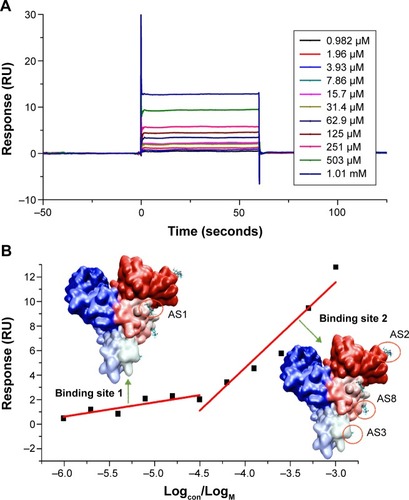
Table 3 Drug-loading (DL) efficiency of BSA-NPs in different AS concentrations (mean ± standard deviation; n=3)
Figure 5 Characterization of AS-BSA-NPs.
Abbreviations: AS-BSA-NPs, bovine serum albumin nanoparticles carrying albuterol sulfate; ABNI, AS-BSA-NPs prepared by incorporation; ABNA, AS-BSA-NPs prepared by adsorption; TEM, transmission electron microscopy.
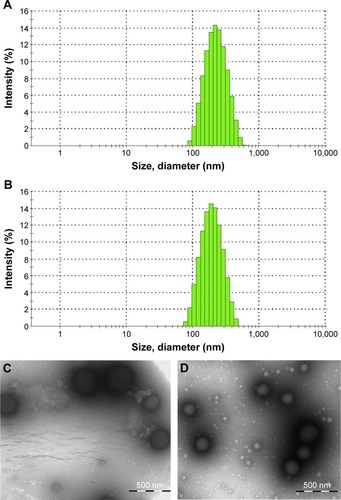
Table 4 Fitting model for the release kinetics of AS from AS-BSA-NPs
Figure 6 In vitro release profiles of AS-BA-NPs and free AS in PBS (pH 7.2) (n=3).
Abbreviations: AS-BSA-NPs, bovine serum albumin nanoparticles carrying albuterol sulfate; ABNI, AS-BSA-NPs prepared by incorporation; ABNA, AS-BSA-NPs prepared by adsorption; PBS, phosphate-buffered saline.
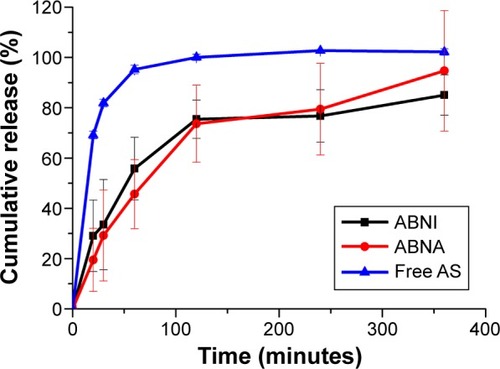
Figure S1 The RMSD of the backbone atoms of the complex with respect to its initial structure during 40 ns MD simulation. The part enclosed in red (25–35 ns) indicates equilibrium.
Table S1 Binding pocket analysis for initial and MD-BSA using DoGSiteScorer