
Figures & data
Figure 1 SEM image of SMV–ALA NPs.
Abbreviations: ALA, alpha-lipoic acid; NPs, nanoparticles; SEM, scanning electron microscope; SMV, simvastatin.
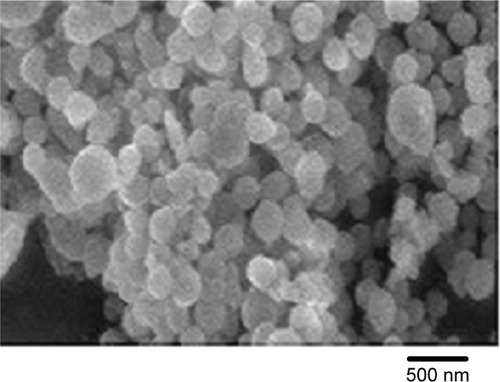
Figure 2 (A) Individual NIR spectra of plasma, SMV, ALA, and test. (B) Raw NIR spectra of plasma at different time intervals after SMV oral administration.
Abbreviations: ALA, alpha-lipoic acid; NIR, near-infrared; SMV, simvastatin.
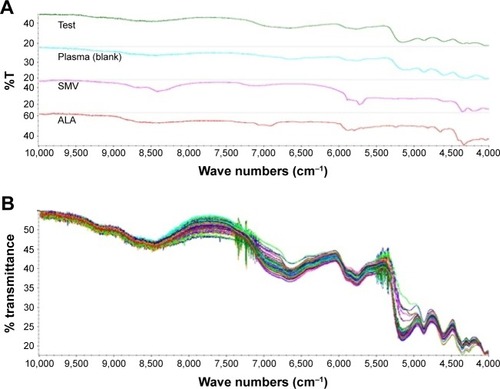
Figure 3 Calibration curve for SMV content in mice plasma.
Abbreviations: NIR, near-infrared; SMV, simvastatin; HPLC, high performance liquid chromatography.
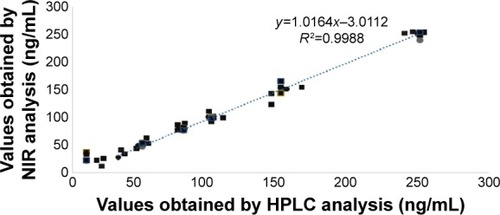
Table 1 Concentrations of SMV plain and SMV–ALA NPs in mice plasma obtained by HPLC and NIR
Figure 4 Relative error for SMV in mice plasma obtained by NIR.
Abbreviations: NIR, near-infrared; SMV, simvastatin.
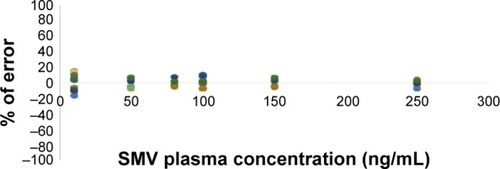
Table 2 Estimated pharmacokinetics of SMV plain and SMV–ALA NPs in mice plasma obtained by HPLC and NIR