
Figures & data
Figure 1 Chemical structure of ARTM.
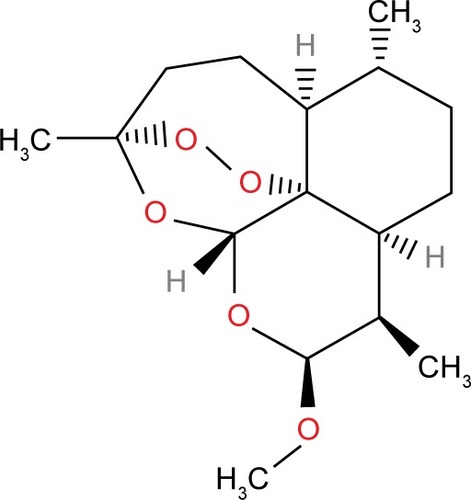
Figure 2 Scanning electron micrographs of unprocessed ARTM (A); transmission electron micrographs of ARTM nanocrystals (B); impact of milling time on particle size reduction (C); and Zeta potential values of different ARTM nanocrystals (D).
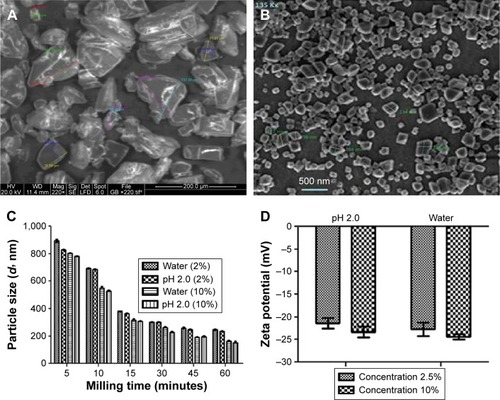
Table 1 Effect of various ARTM concentrations (2.5% and 10%) in water and at pH 2.0 on the mean particle sizes (nm) of ARTM nanocrystals in nanosuspension
Table 2 Effect of various ARTM concentrations (2.5% and 10%) in water and at pH 2.0 on active contents of ARTM nanocrystals
Figure 3 Physical stability of ARTM nanocrystals in terms of monitoring the particle size and PDI at various time points on storage at (A) 2°C–8°C, (B) 25°C, and (C) 40°C.
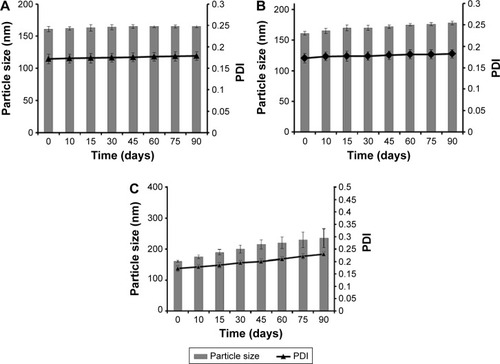
Figure 4 DSC thermogram of milled and unprocessed ARTM (A) and PXRD patterns of unprocessed and milled ARTM (B).
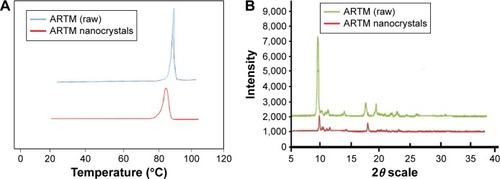
Figure 5 Solubility studies of ARTM nanocrystals, unprocessed ARTM in pure water, and stabilizer solution.
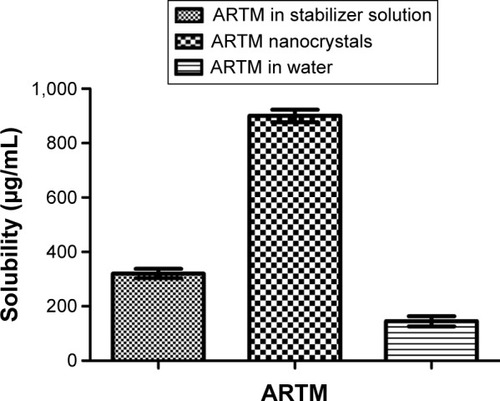
Figure 6 Comparative dissolution profile of ARTM nanocrystals, microsuspension, micronized drug, marketed tablets, and raw ARTM.
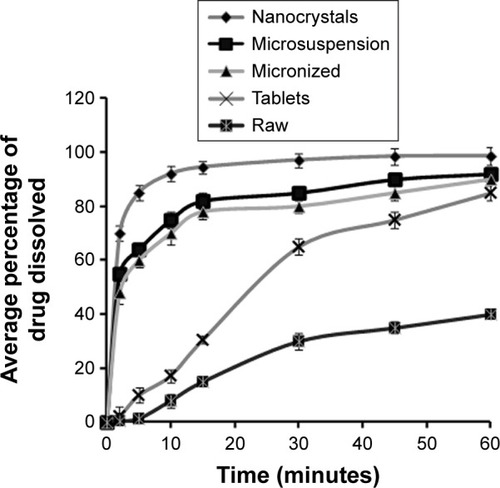
Figure 7 Monitoring of percent parasitemia (A) and antimalarial activities (B) in different groups of mice using ARTM nanocrystals, microsuspension, marketed formulation, and unprocessed ARTM.
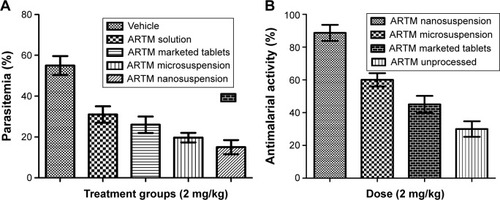
Table 3 Number of Swiss albino mice to survive between the different groups at 2 mg/kg (ARTM)