
Figures & data
Table 1 Comparison of demographic variables and paraclinical data of the participants in three groups before the intervention
Figure 1 Group randomization according to CONSORT 2010.
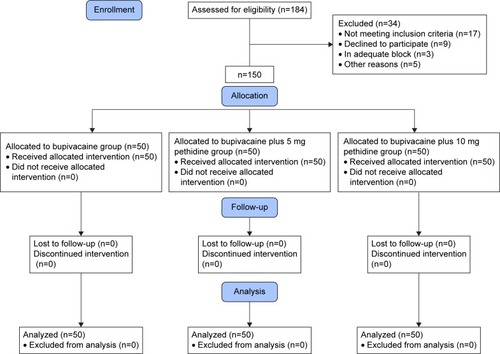
Figure 2 Comparison of the trend of systolic blood pressure during the study among control and intervention groups.
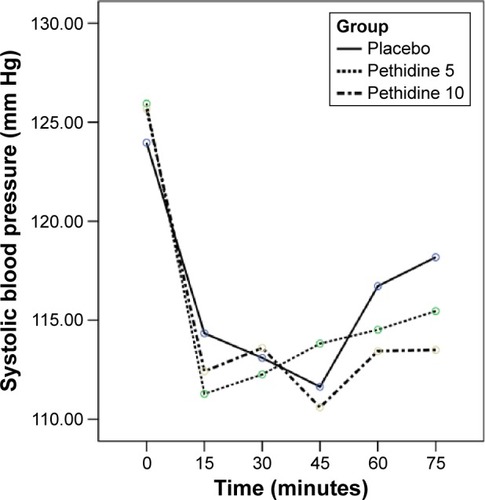
Figure 3 Comparison of the trend of diastolic blood pressure during the study among control and intervention groups.
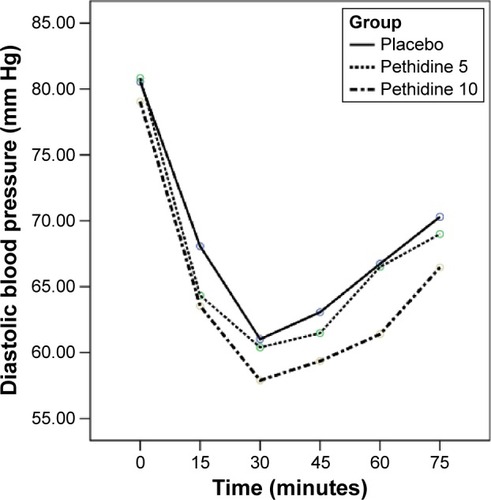
Figure 4 Comparison of the trend of pulse rate during the study among control and intervention groups.
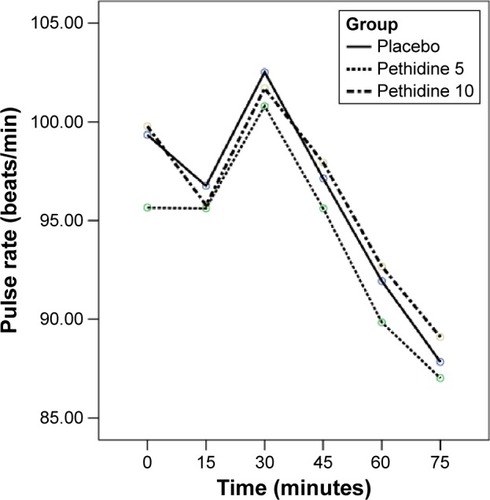
Figure 5 Comparison of the trend of core body temperature during the study among control and intervention groups.
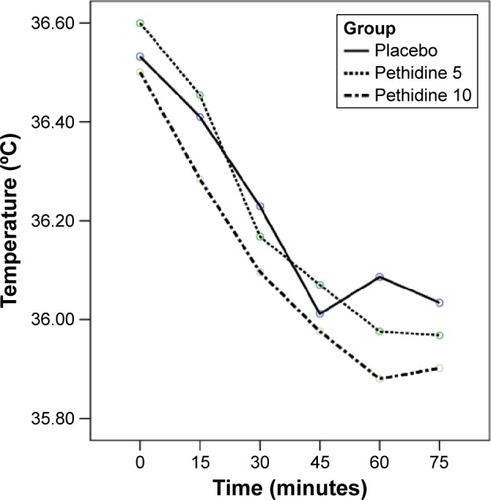
Table 2 Comparison of outcomes in the three groups after the intervention
Table 3 Adverse effects and drug used as rescue treatment in three study groups