Figures & data
Figure 1 Effect of NAC and/or DMSA on arsenic induced changes in serum levels of AST (A), ALT (B), TB (C), TP (D), and albumin (E). Each bar represents mean ± SE of eight animals in each group. Bar superscripts with no common letters (a–e) are significantly different (P<0.05).
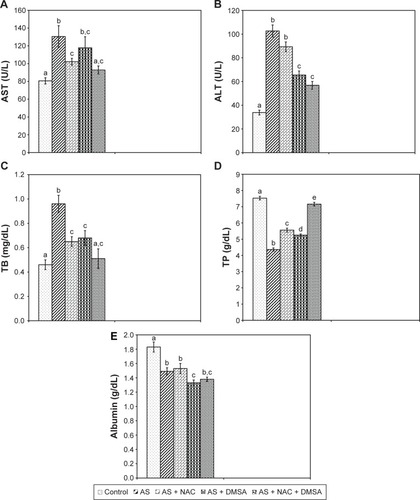
Figure 2 Effect of NAC and/or DMSA on arsenic induced changes in hepatic MDA (A), GSH (B), GR (C), and CAT (D). Each bar represents mean ± SE of eight animals in each group. Bar superscripts with no common letters (a–c) are significantly different (P<0.05).
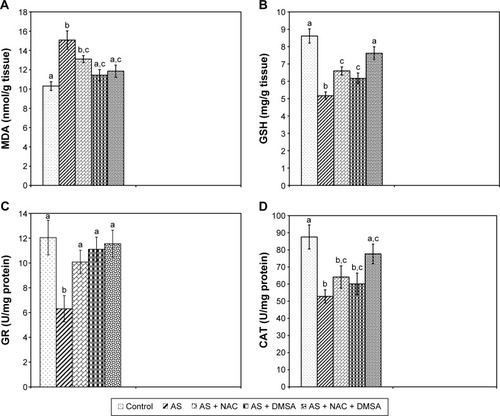
Figure 3 Effect of NAC and/or DMSA on the concentration of arsenic in liver. Each bar represents mean ± SE of eight animals in each group. Bar superscripts with no common letters (a–d) are significantly different (P<0.05).
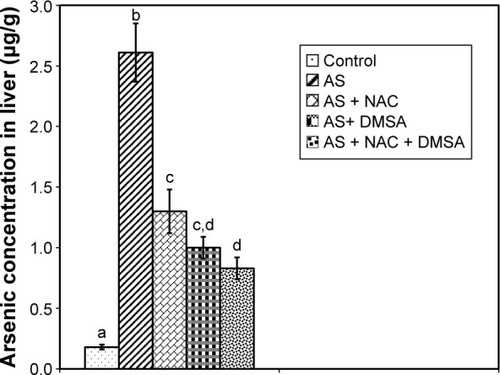
Figure 4 Microphotographs of H and E-stained liver sections of rats. (A) Control depicts normal liver parenchyma. (B) Arsenic: note degeneration of hepatocytes (arrows), vascular congestion/hemorrhage (H), and multiple inflammatory sites (INF). (C) Arsenic + NAC: hepatocytes are intact but congestion and widening of sinusoidal spaces are still found. (D) Arsenic + DMSA: foci of parenchymal degeneration and necrosis are obvious (arrows). (E) Arsenic + NAC + DMSA: liver architecture is comparable to control without inflammatory characteristics. Original magnification 400× (A–E).
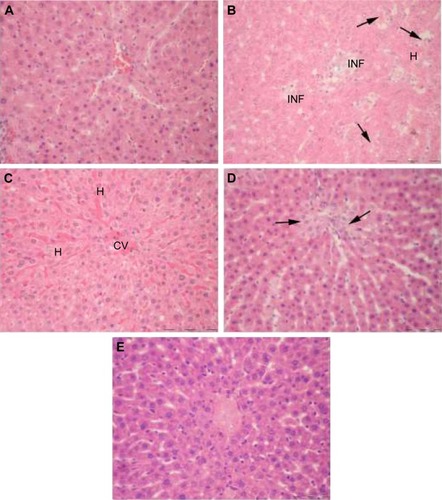
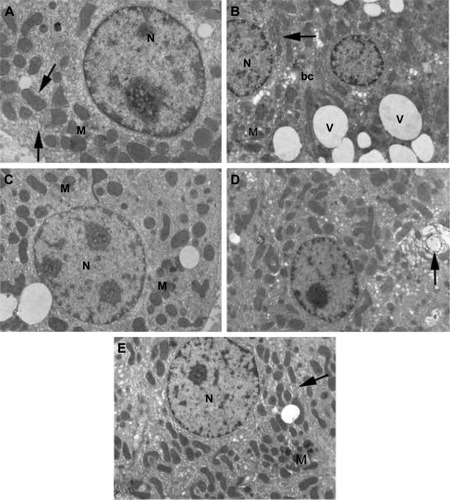
Figure 5 Electron micrographs of liver sections of rats. (A) Control shows hepatocyte with normal cellular organelles and intact nuclear chromatin; N indicates nucleus, M indicates mitochondria, and arrows indicate endoplasmic reticulum. (B) Arsenic observe increased peripheral chromatin in the nucleus (N), mitochondria (M) with ill-defined cristae, few endoplasmic reticulum (arrow) and numerous obvious vacuoles all over the cytoplasm (V); bc indicates bile canaliculus. (C) Arsenic + NAC: note that less condensed chromatin in the nucleus (N), scattered mitochondria (M), and in-between short strands of endoplasmic reticulum are visible. (D) Arsenic + DMSA: the cytoplasm is heavily populated with mitochondria and less fragmented endoplasmic reticulum (compared to B). Notable increase in organelle degeneration is still evident (arrow). (E) Arsenic + NAC + DMSA: hepatocyte is preserved without vacuolization, nucleus (N) without abnormal chromatin, normal mitochondria (M) with intact cristae, normally shaped rough endoplasmic reticulum (arrow). Original magnification 7,500× (A) and 5,000× (B–E).