Figures & data
Table 1 Baseline characteristics of six trials comparing PD-1 inhibitors to chemotherapy or everolimus
Figure 1 Flow chart of selection process for trials included in meta-analysis.
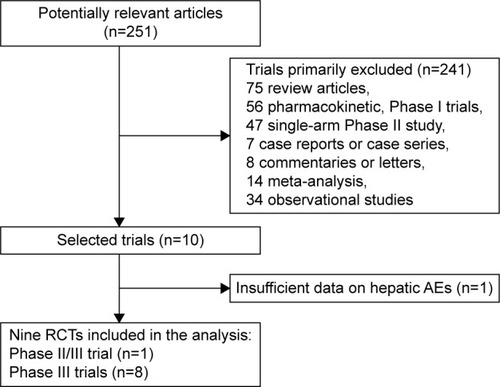
Table 2 Direct comparison among different immune checkpoint inhibitors
Figure 2 Forest plot for meta-analysis of incidence of all-grade elevated ALT (A) and AST (B) and high-grade elevated ALT (C) and AST (D).
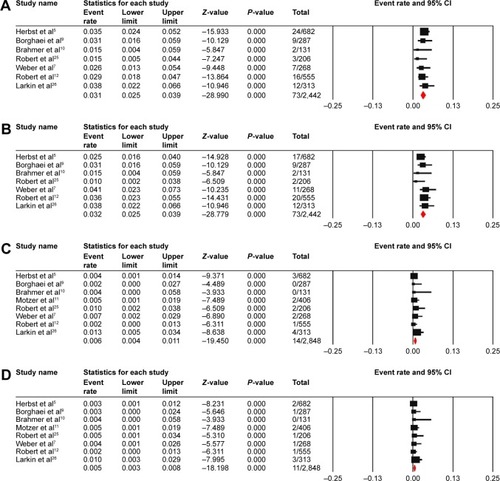
Figure 3 RR of all-grade elevated ALT (A) and AST (B) and high-grade elevated ALT (C) and AST (D) for cancer patients receiving PD-1 inhibitors monotherapy compared with control.
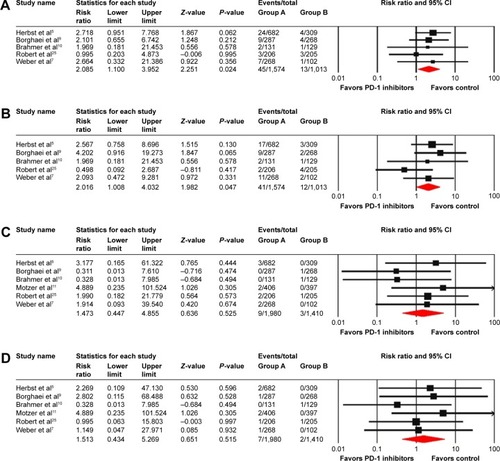
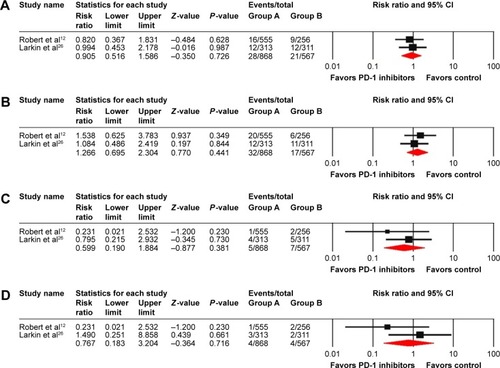
Figure 4 Relative risk of all-grade elevated ALT (A) and AST (B) and high-grade elevated ALT (C) and AST (D) for cancer patients receiving a nivolumab/ipilimumab combination compared with ipilimumab control.
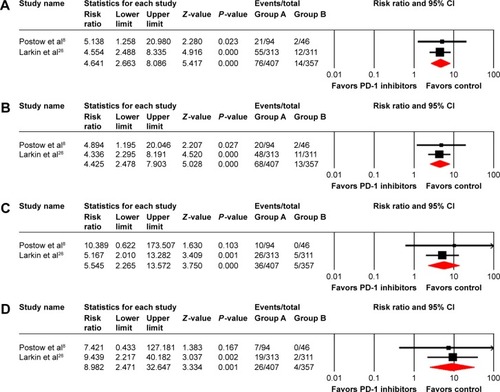
Figure 5 Relative risk of all-grade elevated ALT (A) and AST (B) and high-grade elevated ALT (C) and AST (D) for cancer patients receiving PD-1 inhibitors monotherapy compared with ipilimumab control.