Figures & data
Figure 1 Construction map of the plasmid pEGFP-N2/CR2-sFlt 1.
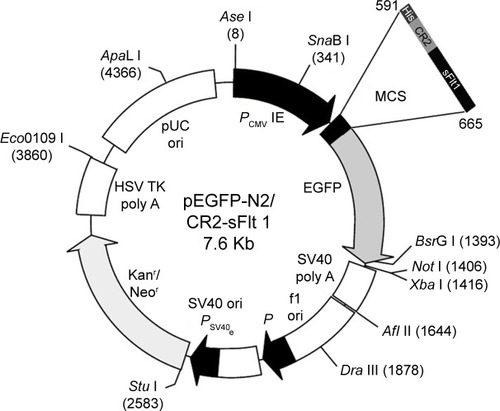
Figure 2 CNV model (A–C) and therapeutic assessment of CR2-sFlt 1 (D).
Notes: (A) IR fundus image of CNV mice induced by laser at the seventh day (green line is scan position of Figure [B], red arrows show laser spot). (B) OCT of CNV mice induced by laser at the seventh day (red arrows show CNV position). (C) The thickness of the CNV complex (red line marking) in morphology measured through HE staining (red arrow shows CNV complex). (D) The thickness analysis of the CNV complex in mice after CR2-sFlt 1 or PBS treatment. Data are expressed as mean ± standard deviation. *P<0.05.
Abbreviations: CNV, choroidal neovascularization; IR, infrared radiation; OCT, optical coherence tomography; HE, hematoxylin and eosin; PBS, phosphate-buffered saline.
Abbreviations: CNV, choroidal neovascularization; IR, infrared radiation; OCT, optical coherence tomography; HE, hematoxylin and eosin; PBS, phosphate-buffered saline.
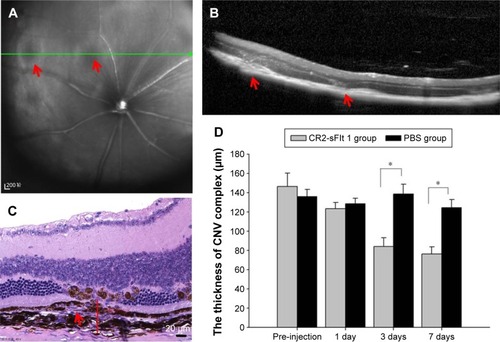
Figure 3 Chemotaxis of the GFP-labeled CR2-sFlt 1 toward complement cleavage fragments in the transwell assay (A–D) and mouse CNV model (E and F).
Notes: (A) GFP signal of CR2-sFlt 1 suspension in the upper chamber before incubation. (B) No GFP signal in the upper chamber suspension after 1 hour incubation. (C) Most increased green signals in the interface membrane of the transwell chamber after 1 hour incubation. (D) Green signals were detected in the lower chamber suspension after 1 hour incubation. (E) Green fluorescence signals in frozen sections of eye tissue in the CR2-sFlt 1-treated group. (F) Green fluorescence signals merged with corresponding HE staining.
Abbreviations: GFP, green fluorescent protein; CNV, choroidal neovascularization; HE, hematoxylin and eosin.
Abbreviations: GFP, green fluorescent protein; CNV, choroidal neovascularization; HE, hematoxylin and eosin.
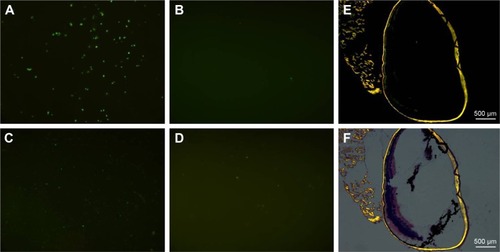
Figure 4 Concentration analysis of VEGF in the supernatant of the RPE cells treated with CR2-sFlt 1 (84 [A], 420 [B], and 840 μg/mL [C]) and bevacizumab (D).
Notes: Data are expressed as mean ± standard deviation. *P<0.05.
Abbreviations: VEGF, vascular endothelial growth factor; RPE, retinal pigmented epithelial; OD, optical density.
Abbreviations: VEGF, vascular endothelial growth factor; RPE, retinal pigmented epithelial; OD, optical density.
![Figure 4 Concentration analysis of VEGF in the supernatant of the RPE cells treated with CR2-sFlt 1 (84 [A], 420 [B], and 840 μg/mL [C]) and bevacizumab (D).](/cms/asset/a6acad7f-694e-4128-8336-a7339365241b/dddt_a_12173082_f0004_b.jpg)
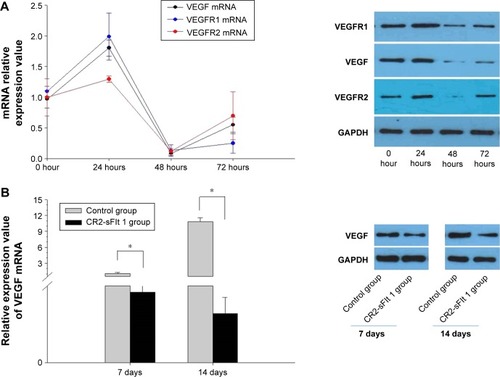
Figure 5 Effects of CR2-sFlt 1 on VEGF and VEGFR expression.
Notes: (A) Real-time PCR analysis and immunoblotting of VEGF, VEGFR1, and VEGFR2 expression products in the RPE cells 24, 48, and 72 hours after CR2-sFlt 1 intervention. Data are expressed as mean ± standard deviation. (B) With PBS injections, real-time PCR analysis and immunoblotting of VEGF expression products in the CNV mice after CR2-sFlt 1 intervention on the first and seventh days. Data are expressed as mean ± standard deviation. *P<0.05.
Abbreviations: VEGF, vascular endothelial growth factor; VEGFR, vascular endothelial growth factor receptor; RPE, retinal pigmented epithelial; CNV, choroidal neovascularization; PCR, polymerase chain reaction; PBS, phosphate-buffered saline.
Abbreviations: VEGF, vascular endothelial growth factor; VEGFR, vascular endothelial growth factor receptor; RPE, retinal pigmented epithelial; CNV, choroidal neovascularization; PCR, polymerase chain reaction; PBS, phosphate-buffered saline.