Figures & data
Figure 1 Chemical structures, in vitro affinities, and in vivo potencies of previously described H3R ligands PIT (1, Wakix®)Citation22 and DL-77 (2).Citation19,Citation30,Citation72
Abbreviations: H3R, H3 receptor; PIT, pitolisant; p.o., peroral.
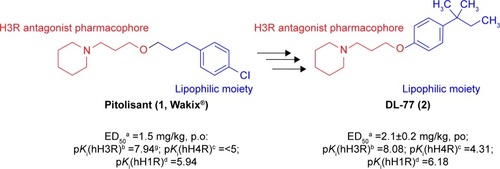
Table 1 Affinities of test compounds 3–14 at hH3R stably expressed in HEK cells
Figure 2 Protective effect of acute systemic injection of H3R ligands 3–14 on MES-induced convulsions in rats.
Abbreviations: H3R, H3 receptor; MES, maximal electroshock; PHT, phenytoin; PIT, pitolisant; THLE, tonic hind limb extension; PYR, pyrilamine; ZOL, zolantidine; SEM, standard error of the mean; SAL, saline.
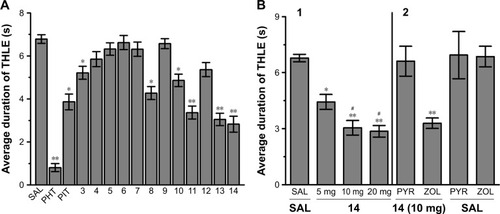
Figure 3 Protective effect of H3R ligands 3–14 pretreatment on PTZ-induced convulsions in rats.
Abbreviations: H3R, H3 receptor; PTZ, pentylenetetrazole; VPA, valproic acid; PIT, pitolisant; SEM, standard error of the mean; PYR, pyrilamine; ZOL, zolantidine.
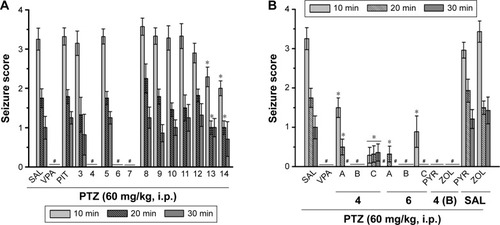
Figure 4 Protective effect of H3R ligands 3–14 pretreatment on STR-induced convulsions in rats.
Abbreviations: H3R, H3 receptor; STR, strychnine; VPA, valproic acid; PIT, pitolisant; SEM, standard error of the mean; PYR, pyrilamine; ZOL, zolantidine; PTZ, pentyl-enetetrazole.
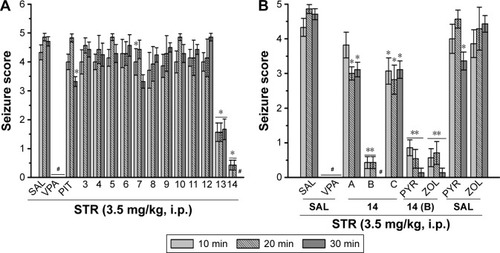
Table 2 Practical (RM0) and theoretical lipophilicity values for the series of described compounds
Table 3 The number of metabolites of selected H3R ligands and their molecular masses
Figure 5 The plot of MetaSite predictions for sites of metabolism of compounds 2, 4, 6, 7, and 14.
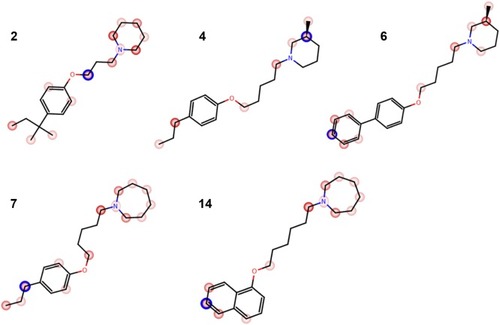
Figure 6 The UPLC spectrum after 120 min reaction of 2, 4, 6, 7, and 14 with HLMs.
Abbreviation: H3R, H3 receptor.
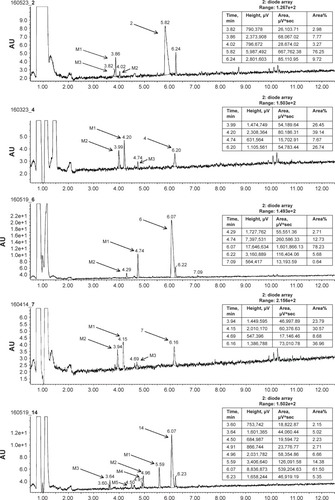
Figure 7 (A) Ion fragment analysis and probable structure of the main metabolite M1 of compound 2. (B) Ion fragment analysis and probable structure of the main metabolite M1 of compound 4. (C) Ion fragment analysis and probable structure of the main metabolite M1 of compound 6. (D) Ion fragment analysis and probable structure of the main metabolite M1 of compound 7. (E) Ion fragment analysis and two proposed structures of the main metabolite M1 of compound 14.
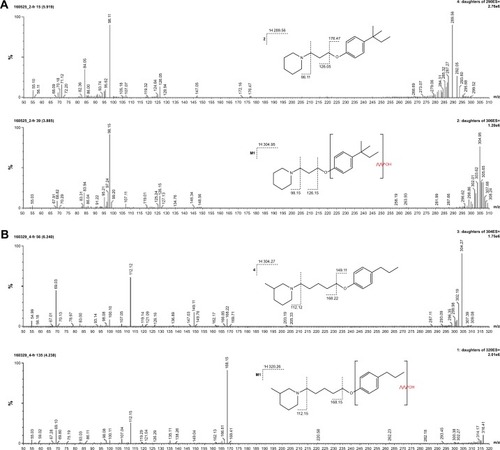
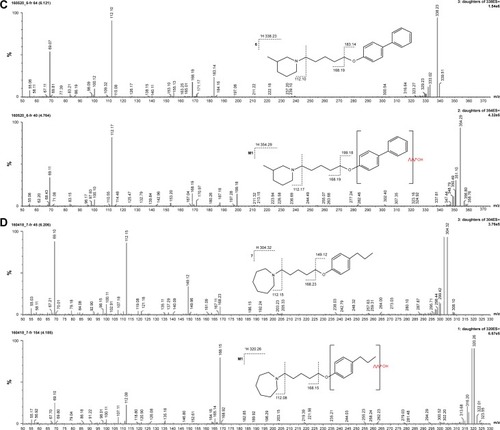
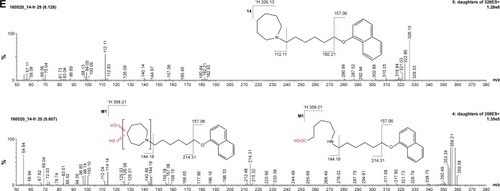
Figure 8 (A) Effect of KE and compounds 2, 4, 6, 7, and 14 on CYP3A4 activity. (B) Effect of QD and compounds 1, 2, 4, 6, 7, and 14 on CYP2D6 activity. (C) Activity of the reference DX and compounds 2, 4, 6, 7, and 14 against HEK-293 cell line.
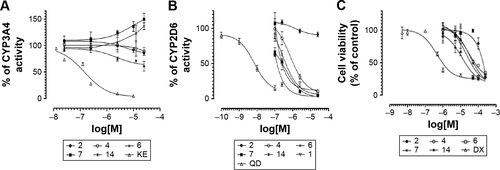
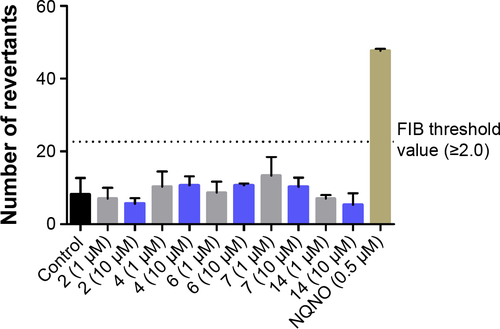
Figure 9 Increase of histidine prototrophy revertants over baseline for Salmonella typhimurium strain TA98, exposed to H3R ligands (1 or 10 µM) or reference mutagen NQNO (0.5 µM).
Abbreviations: H3R, H3 receptor; NQNO, nonyl-4-hydroxyquinoline-N-oxide.
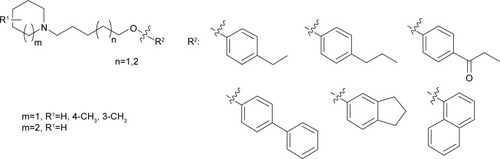
Scheme 1 General structure of tested compounds (3–14).