Figures & data
Table 1 Composition of the DPI products containing an optimal concentration of excipients
Table 2 Büchi Mini Dryer B-191 parameters for spray-drying procedure
Figure 1 Ishikawa diagram illustrating the parameters influencing the quality of the ciprofloxacin-containing DPI product.
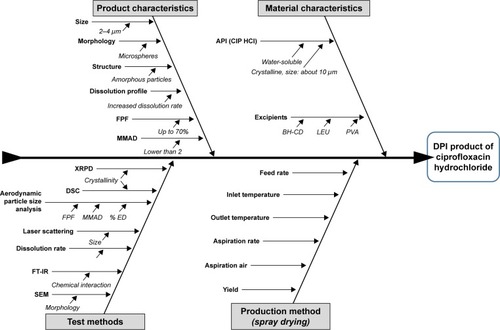
Table 3 Selected QTPPs, CQAs, and CPPs of a ciprofloxacin-containing DPI formula, their target, justification, and explanation
Figure 2 Results of (A) the interdependence rating of the QTPPs and CQAs and of the CPPs and CQAs, (B) the occurrence rating of the CPPs, and (C) Pareto charts of the CQAs and CPPs with calculated numeric severity scores generated by the RA software.
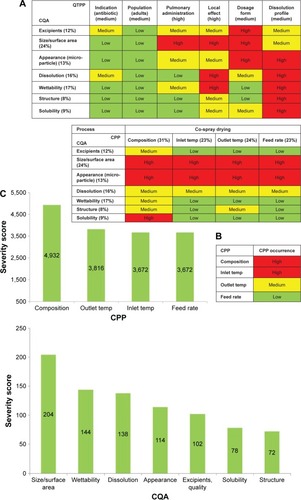
Table 4 Particle size of the microparticles of various compositions prepared
Figure 3 Scanning electron micrographs of the spray-dried microparticles.
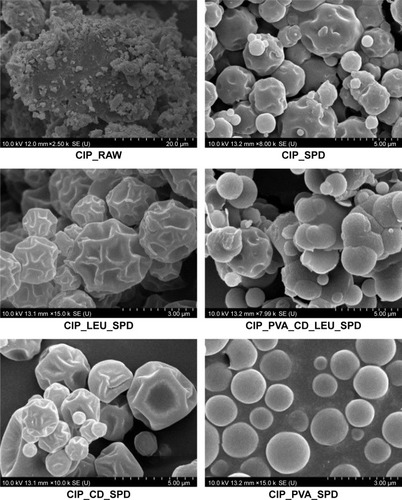
Figure 4 Thermograms of raw CIP and of the different CIP-containing microparticles investigated.
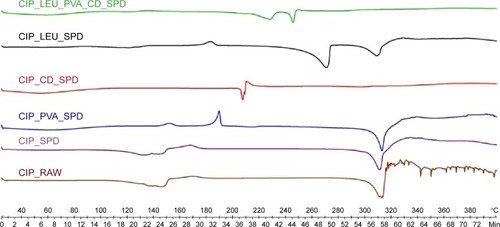
Figure 5 XRPD diffractograms of raw CIP and of the CIP-containing microparticle compositions investigated.
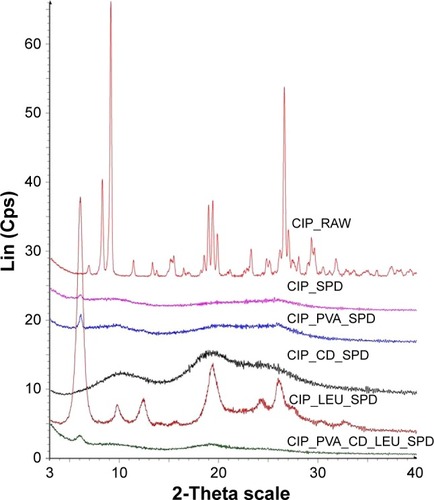
Figure 6 FT-IR spectra of ciprofloxacin hydrochloride (CIP) and the CIP-containing microparticle compositions investigated.
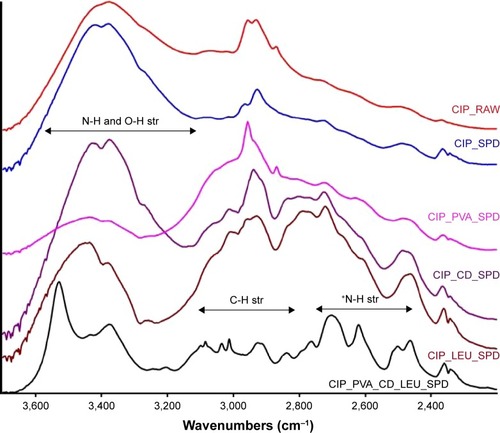
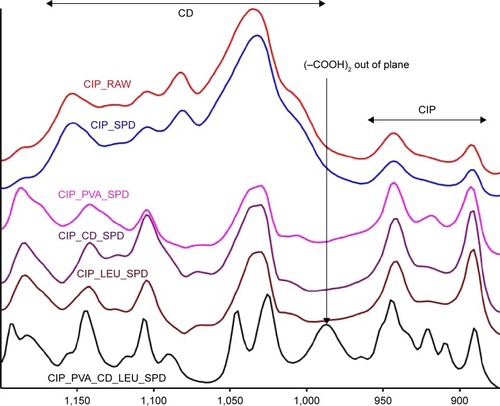
Table 5 Drug content, fine particle fraction (FPF), mass median aerodynamic diameter (MMAD), and emitted dose (ED) of the CIP-containing microparticle compositions investigated
Table 6 Maximum measured concentration of ciprofloxacin hydrochloride filtered saturated solution
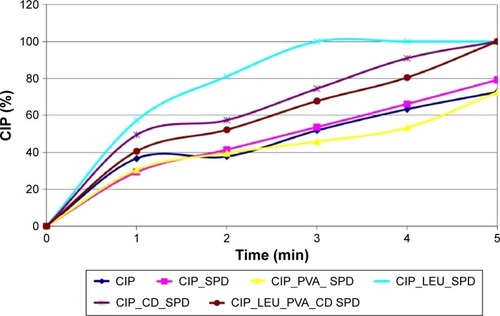
Figure 7 Kinetic plots of free ciprofloxacin release from the microparticles investigated.