
Figures & data
Figure 1 Chromatographs and mass spectra produced by liquid chromatography–mass spectrometry.
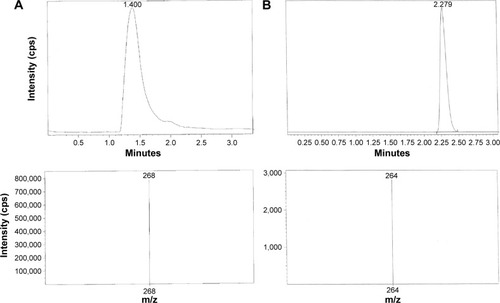
Table 1 Mean residual concentration (μg/mL) of apomorphine HCl solutions, mean residual concentration (%), and color observed after specificity assay/forced degradation
Figure 2 Chromatographs of specificity assay/forced degradation of apomorphine HCl.
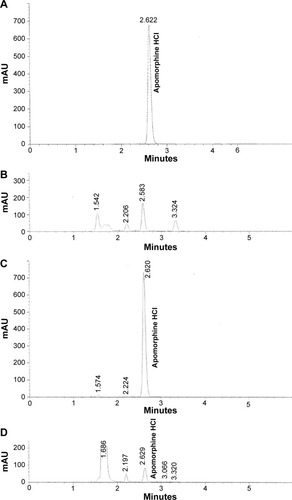
Figure 3 Natural logarithm (ln) of mean residual concentration (%) of apomorphine HCl solutions (50 μg/mL) in different antioxidant solutions over 336 hours at 25°C.
Abbreviations: AA, L-ascorbic acid; SMB, sodium metabisulfite.
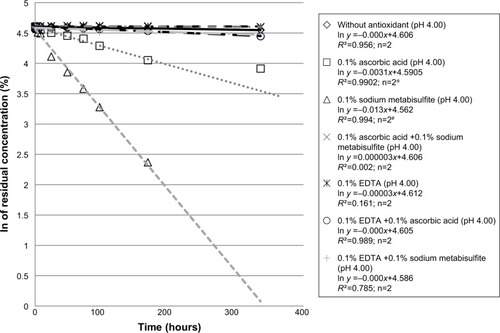
Figure 4 Natural logarithm (ln) of mean residual concentration (%) of apomorphine HCl solutions (50 μg/mL) in different antioxidant solutions over 336 hours at 32°C.
Abbreviations: AA, L-ascorbic acid; SMB, sodium metabisulfite.
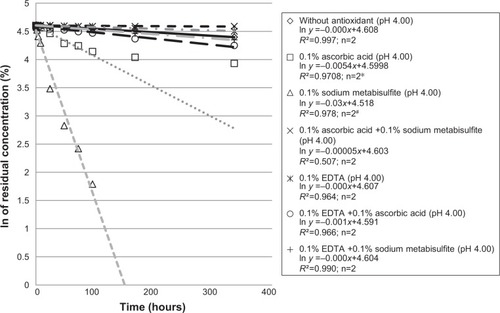
Figure 5 Natural logarithm (ln) of mean residual concentration (%) of apomorphine HCl solutions (50 μg/mL) in different antioxidant solutions over 336 hours at 37°C.
Abbreviations: AA, L-ascorbic acid; SMB, sodium metabisulfite.
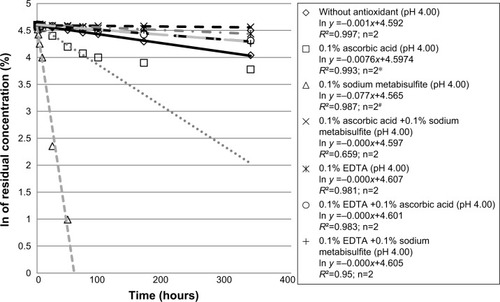
Table 2 Mean residual concentration (%), color changes, and final pH values of apomorphine HCl sample solutions (which were colorless initially) after 336 hours
Table 3 Mean residual concentration (μg/mL), mean residual concentration (%), color changes, initial pH and post-study pH of 10 mg/mL and 50 μg/mL apomorphine HCl solutions (purged with nitrogen) after 168 hours
Figure 6 Natural logarithm (ln) of mean residual concentration (%) of 10 mg/mL and 50 μg/mL apomorphine HCl in 0.1% SMB solutions (with and without buffer; both purged with nitrogen) over 168 hours at 25°C.
Abbreviation: SMB, sodium metabisulfite.
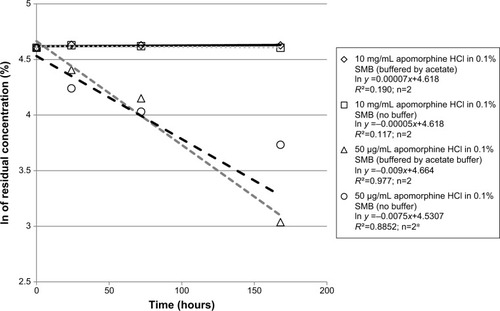
Table 4 Mean residual concentration (%), mean residual concentration (mg/mL) and color observation, initial pH and post-study pH of 10 mg/mL apomorphine HCl (without nitrogen purging) in 0.1% AA solution and 10 mg/mL apomorphine HCl in 0.1% EDTA solution at 25°C after 72 hours