Figures & data
Table 1 Composition of tested peritoneal dialysis solutions
Figure 1 Effect of PDSs on intracellular peroxynitrite levels in C- and GD-HUVECs.
Notes: Flow cytometry evaluation of peroxynitrite in C- (gray bars) and GD-HUVECs (black bars) untreated (basal) or exposed to PDSs. Results are expressed as the percentage of peroxynitrite-positive cells ± SD of at least three different experiments. Student’s t-test: ωP<0.05 versus C-HUVECs basal. Statistically significant difference in Bonferroni post hoc test: #versus GD-HUVECs basal and PDS glucose 1.36% and 2.27%, θversus C-HUVECs PDS xylitol 0.7% and 1.5%, *versus C-HUVECs PDS glucose 1.36% and 2.27%; for each symbol P<0.05.
Abbreviations: C, control; GD, gestational diabetes; HUVECs, Human Vein Endothelial Cells; PDS, peritoneal dialysis solution; SD, standard deviation.
Abbreviations: C, control; GD, gestational diabetes; HUVECs, Human Vein Endothelial Cells; PDS, peritoneal dialysis solution; SD, standard deviation.
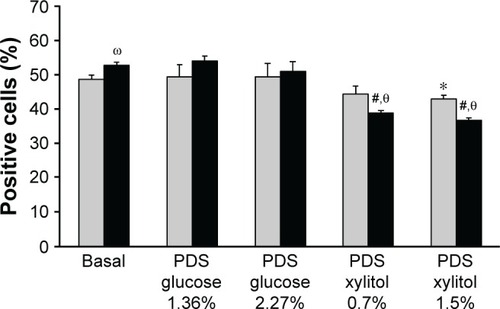
Figure 2 Effect of PDSs on adhesion molecules exposure in C- and GD-HUVECs.
Notes: Flow cytometry evaluation of ICAM-1 (A) and VCAM-1 (B) membrane exposure in C- (gray bars) and GD-HUVECs (black bars) untreated (basal) or exposed to PDSs. ICAM-1 and VCAM-1 membrane exposure levels are expressed as fold increase ±SD (at least three different experiments) of the MFI ratio versus basal condition. MFI ratio was calculated by dividing the MFI of positive events by the MFI of negative events. (A) Student’s t-test: ωP<0.05 versus C-HUVECs basal. Statistically significant difference in Bonferroni post hoc test: *versus C-HUVECs basal, §versus C-HUVECs PDS glucose 2.27%, #versus GD-HUVECs PDS glucose 2.27%, θversus C-HUVECs PDS xylitol 1.5%; for each symbol P<0.05. (B) Student’s t-test: ωP<0.02 versus C-HUVECs basal. Statistically significant difference in Bonferroni post hoc test: *versus C-HUVECs basal, #versus C-HUVECs PDS glucose 1.36%, θversusC-HUVECs PDS glucose 2.27%; for each symbol P<0.05.
Abbreviations: C, control; GD, gestational diabetes; HUVECs, Human Vein Endothelial Cells; ICAM-1, Intercellular Adhesion Molecule-1; MFI, mean fluorescence intensity; PDS, peritoneal dialysis solution; SD, standard deviation; VCAM-1, Vascular Cell Adhesion Molecule-1.
Abbreviations: C, control; GD, gestational diabetes; HUVECs, Human Vein Endothelial Cells; ICAM-1, Intercellular Adhesion Molecule-1; MFI, mean fluorescence intensity; PDS, peritoneal dialysis solution; SD, standard deviation; VCAM-1, Vascular Cell Adhesion Molecule-1.
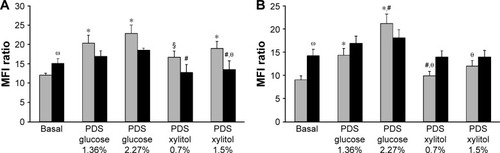
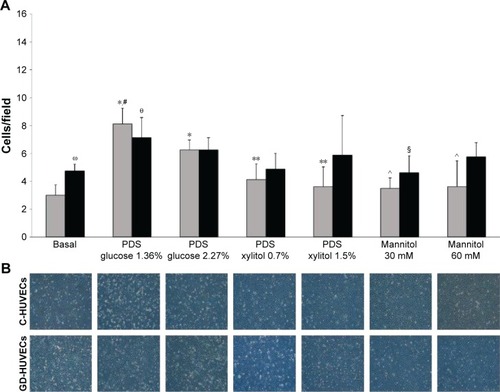
Figure 3 Effect of PDSs on monocyte adhesion to C- and GD-HUVECs.
Notes: (A) C- (gray bars) and GD-HUVECs (black bars) U937 interaction was evaluated in cells untreated (basal) or exposed to PDSs or to mannitol (as hyperosmolar control). Quantitative data show the number of U937 cells adhering within a high-power field (3.5 mm2), with each measurement consisting of eight counts for every condition. Results are expressed as mean ± SD of at least three different experiments. Student’s t-test: ωP<0.05 versus C-HUVECs basal. Statistically significant difference in Bonferroni post hoc test: *versus C-HUVECs basal, #versus C-HUVECs PDS glucose 2.27%, θversus GD-HUVECs basal, **versus C-HUVECs PDS glucose 1.36% and 2.27%, ^versus C-HUVECs PDS glucose 1.36%, §versus GD-HUVECs glucose 1.36%; for each symbol P<0.05. (B) Representative images of U937 cell adhesion to C- and GD-HUVECs.
Abbreviations: C, control; GD, gestational diabetes; HUVECs, Human Vein Endothelial Cells; PDS, peritoneal dialysis solution; SD, standard deviation.
Abbreviations: C, control; GD, gestational diabetes; HUVECs, Human Vein Endothelial Cells; PDS, peritoneal dialysis solution; SD, standard deviation.