Figures & data
Figure 1 Chromatographic fingerprint analysis of the aqueous BJ extract. Twelve major components in BJ extract were recognized by LC/MS chromatogram. The peak ESI (−) mode as identified including: 1) Bruceoside D (10.6 min); 2) Bruceine E (15.7 min); 3) Bruceine F (17.5 min); 4) Bruceine D (18.6 min); 5) Bruceine B (37.0 min); 6) Bruceine I (39.2 min); 7) Bruceine J (44.2 min); 8) Yadanzioside F (44.7 min); 9) Bruceantinol B (47.7 min); 10) Brusatol (49.2 min); 11) Bruceine A (50.8 min), and 12) Bruceoside E (57.2 min).
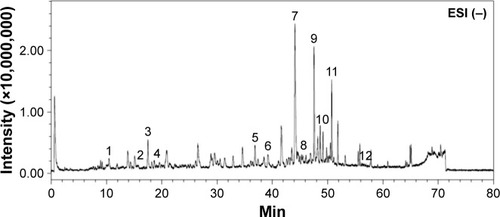
Figure 2 Dose-response growth curves of BJ extract in NSCLC H1975 cells. The increased concentration of aqueous BJ extracts after 12 hours of treatments reduced viable H1975 cells. The trypsinized cells were counted for the numbers of viable cells using trypan blue exclusion assay. The percentages of viabilities were obtained by comparing cell numbers at each concentration with water control that was assigned as 100%. The data are the average of quadruplicate for each experiment. The results are presented as mean ± SD of three independent experiments. *P<0.05 and **P<0.01.
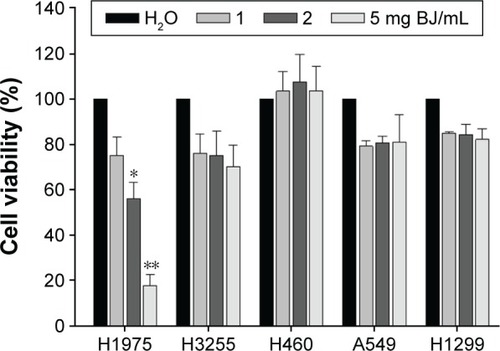
Figure 3 The aqueous BJ extract increased apoptotic distributions of H1975 cells by (A) dose-dependent appearance of sub-G1 cells. Human NSCLC cells H1975 cultured in 1% serum-supplemented DMEM were incubated with various concentrations of BJ extract (1, 2, and 5 mg/mL) or water for 12 hours before being labeled with PI followed by flow cytometry analysis. (B) Cell cycle distribution. The percentages of cell cycle distribution in H1975 cells following treatment were analyzed. The results of BJ treatment were compared with those of water control. *P<0.05. **P<0.01. (C) Histograms of two-dimensional flow cytometry H1975 cells were treated with various concentrations of BJ for 12 hours and the trypsinized cells labeled with Annexin V and PI were analyzed by flow cytometry. (D) Quantitative analysis of the apoptotic cell populations. Populations of early (dark) and late (light) apoptotic distributions in H1975 cells treated with various concentrations of BJ were analyzed. The results were expressed as mean values from three independent experiments.
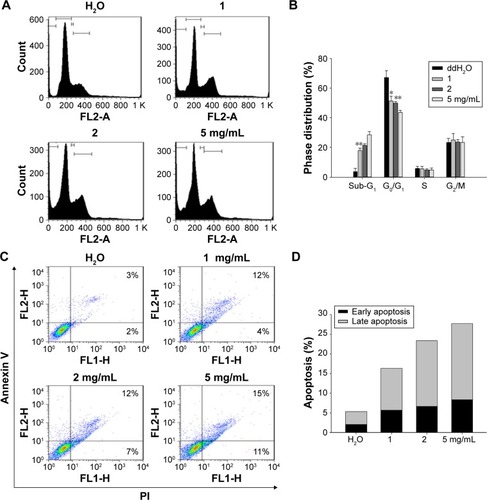
Figure 4 BJ induced apoptosis and reduced EGFR and pEGFRY1068 levels in H1975 cells. (A) Western blot analysis. The protein lysates from H1975 cells as treated with 1, 2, and 5 mg/mL of BJ extract for 12 hours were collected and used for Western blot analysis. The blots were incubated with various primary antibodies, including EGFR, phosphorylated EGFRY1068, Akt, phosphorylated AktS473, caspase-3, and PARP as specified, which were followed by HRP-conjugated secondary antibodies. GAPDH was used as loading control. The blots were visualized by ECL detection system. (B) Densitometric determination of EGFR and phosphorylated EGFRY1068 amelioration. The densitometric ratios of EGFR and phosphorylated EGFRY1068 in H1975 cells from Western blot analysis were obtained by first normalizing individual band intensity at each concentration to that of the loading control and compared with those of water treatment. The results were expressed as mean values of three independent experiments (*P<0.05, **P<0.01, unpaired Student’s t-test as compared with control water).
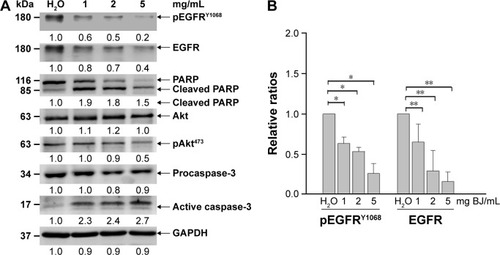
Figure 5 EGFR shRNA reduced BJ sensitivities by suppressing apoptosis. (A) Viability determination. H1975 cells transfected with EGFR shRNA or NS control for 24 hours were treated with 2 mg/mL of BJ extract for 12 hours and the collected cells counted by trypan blue exclusion assay. Symbol (-) meant no transfection. The results were expressed as mean values from three independent experiments. *P<0.05 and **P<0.01 indicated significant difference between groups. (B) Western blot analysis. Proteins of H1975 cells transfected with EGFR shRNA and NS control before being treated with BJ extract (2 mg/mL) or water were subjected to Western blot analysis. The antibodies included EGFR, phosphorylated EGFRY1068, PARP and loading control GAPDH. Symbol (−) indicated no transfection.
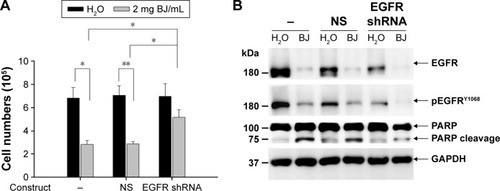
Figure 6 Oral administration of BJ reduced xenograft tumor growth. (A) BJ extract suppressed the growth of xenograft tumors in animal models. Nude BALB/c mice with established xenograft tumors of H1975 cells were administered orally with 1 and 2 g BJ/kg daily for 7 consecutive days (arrows). The graph represented tumor growth variation (y-axis) from the start of feeding (x-axis). Mice fed with aqueous BJ extract showed reduced tumor growth compared with those with water. *P<0.05 indicated significant difference in the measured tumor volumes between mice fed with 2 g BJ/kg and those with water from three individual experiments with six mice in each group. (B) The body weights of the nude mice. No significant difference was seen in the average body weight of mice with established xenograft H1975 tumors orally administered water, 1 and 2 g BJ/kg daily for 7 consecutive days (arrow). The graph represented variations of mice weight (y-axis) from the start of feeding in days (x-axis). (C) The decreased resected tumor weights. Tumor weights of the resected xenograft tumors were suppressed in mice with gavage feeding of BJ compared with those of water. The horizontal bars represented mean values of tumor mass as collected following different treatments. *P<0.05 indicated significant weight difference between mice fed with 2 g BJ/kg and those with water. Each graph is representative of three independent experiments.
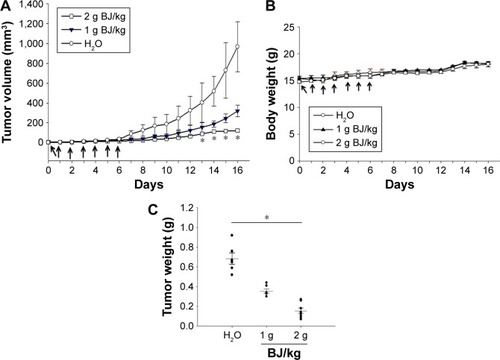
Figure 7 Histological and fluorescence examination of the reduced tumors. (A) Examination by HE staining. The paraffin-embedded H1975 tumors treated with BJ (2 g/kg) and water control were dissected, stained by HE and analyzed by confocal microscopy (scale bar =100 μm). The rectangular inset of the image were zoomed-in to the right of the panel for each treatment (scale bar =25 μm). The white arrow signifies apoptotic body location. (B) Release of mitochondrial cytochrome c in tumors treated with BJ. The dissected specimens of H1975 tumors as treated with BJ (1 and 2 g/kg) and water control were fixed and incubated with antibody against cytochrome c followed by staining with secondary antibody conjugated with TRITC (red). The slides were counter-stained with mitotracker (green) and DAPI (blue) before being analyzed by confocal microscopy. The merged images of red color cytochrome c and green color mitochondria signified the appearance of puncta (yellow), while blue color indicates nucleus (scale bar =50 μm). (C) Images of immunofluorescent EGFR H1975 tumor sections from mice fed with 2 g/kg of BJ and water control were incubated with EGFR antibody (green) followed by FITC-conjugated secondary antibody treatment before being counterstained with DAPI (blue) (scale bar =50 μm). (D) Images of immunofluorescent pEGFRY1068 H1975 tumor sections from mice fed with 2 g/kg of BJ and water control were incubated with pEGFRY1068 antibody (green) followed by FITC-conjugated secondary antibody incubation before being counterstained with DAPI (blue) (scale bar =50 μm).
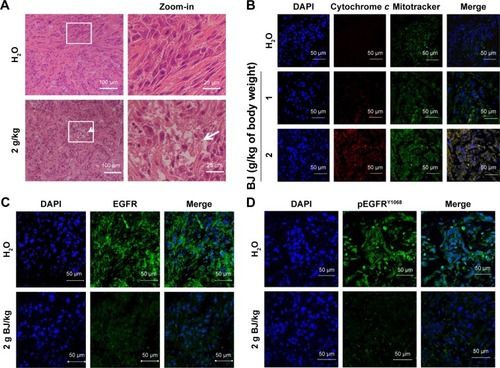
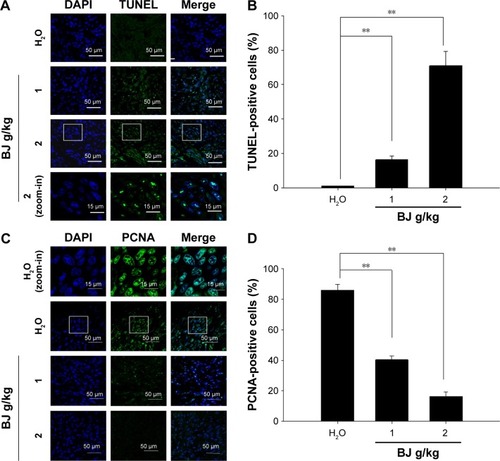
Figure 8 Tumor growth suppression by apoptosis. (A) Dose-dependent increase of TUNEL staining. The tumors removed from the mice fed with water, 1 and 2 g BJ/kg were frozen, resected, fixed, and subjected to TUNEL experiment for confocal microscopy analysis. The apoptotic bodies (green) were counterstained with DAPI (blue) and visualized (scale bar =50 μm). The image of rectangular inset of tumor sections in mice treated with 2 g BJ/kg was zoomed-in to the bottom of the panel (scale bar =15 μm). (B) BJ increased TUNEL-positive nuclei intensities. The number of fluorescent TUNEL-positive cells counted in each field was 100, as marked by DAPI staining. The numbers of TUNEL-positive cells at various BJ concentrations were the average of at least three different fields. The data were expressed as the mean of three individual experiments (**P<0.01). (C) Dose-dependent decrease of stained nucleus PCNA. Tumor sections were incubated with rabbit antibody against PCNA followed by FITC-conjugated secondary antibody. The slides with PCNA fluorescence (green) were counterstained with DAPI (blue) before being analyzed by confocal microscopy (scale bar =50 μm). The images of rectangular inset of tumor sections in mice treated with water were zoomed-in to the top of the panel (scale bar =15 μm). (D) BJ decreased mitotic index PCNA signals in nucleus. The number of fluorescent nucleus PCNA-positive cells counted in each field was 100, as marked by DAPI staining. The numbers at various BJ concentrations were the average of at least three different fields. The data were expressed as the mean of three individual experiments (**P<0.01).