Figures & data
Figure 1 Design of compounds to bind to hIL-6R.
Notes: (A) Key residues of hIL-6 identified by hIL-6R. Red lines denote hIL-6R, green balls denote key residues in loop AB of hIL-6 and red balls denote key residues in hIL-6 within the distance of 0.4 nm. (B) The spherical surface of hIL-6 binding to hIL-6R displayed by the program Ludi, in which green lines denote hIL-6R and pink balls denote active center of hIL-6. (C) Selected areas in hIL-6 for new compound screening, which were separated into three regions: Q1, Q2, and Q3. (D) Chemical structures of hIL-6 antagonist compounds 1, 2, and 3 targeting Q1, Q2, and Q3, respectively, screened from 3D-ACD or MDDR library.
Abbreviations: 3D-ACD, three-dimensional-Available Chemicals Directory; MDDR, MDL Drug Data Report.
Abbreviations: 3D-ACD, three-dimensional-Available Chemicals Directory; MDDR, MDL Drug Data Report.
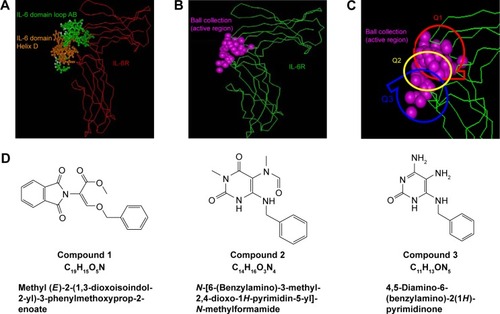
Table 1 Key residues and binding energy between hIL-6R and compounds
Figure 2 Theoretical analysis of candidate compounds binding to hIL-6R.
Notes: (A) Theoretical structures of compounds/hIL-6R complexes; pink lines denote carbon chain of hIL-6R, while balls and sticks denote compounds, in which green balls represent carbon atom, white balls denote hydrogen, blue balls represent nitrogen and red balls denote oxygen. (B) Crucial regions of hIL-6R recognized by the compounds and reaction mode analysis of the complexes. (C) Functional region of three complexes. Pink lines denote hIL-6R and yellow balls denote residues of hIL-6R recognized by compounds, while other balls and sticks denote compounds, in which green balls represent carbon atom, white balls represent hydrogen, blue balls represent nitrogen and red balls represent oxygen.
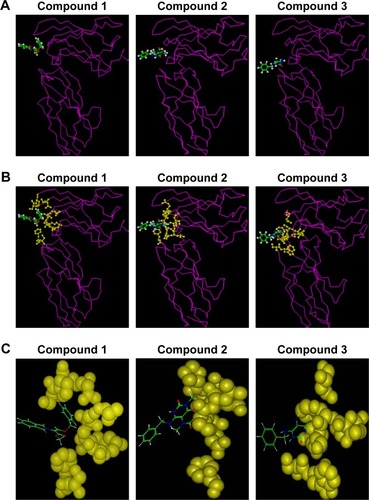
Figure 3 Competing ELISA analysis of compounds at different concentrations to bind to hIL-6R.
Notes: (A) The binding activity of compounds. NEG: NEG control (PBS); DMSO: DMSO control (0.1% DMSO), n=3, *P<0.05, **P<0.01 vs DMSO control. (B) Inhibition ratio of the three compounds. Average results from a triplex experiment are shown together with the mean ± SD values.
Abbreviations: ELISA, enzyme-linked immunosorbent assay; NEG, negative; PBS, phosphate-buffered saline; DMSO, dimethyl sulfoxide; SD, standard deviation; OD, optical density.
Abbreviations: ELISA, enzyme-linked immunosorbent assay; NEG, negative; PBS, phosphate-buffered saline; DMSO, dimethyl sulfoxide; SD, standard deviation; OD, optical density.
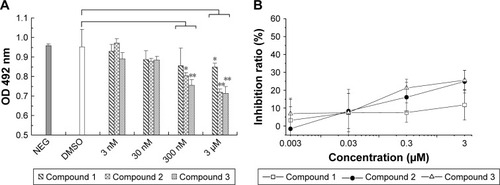
Figure 4 The inhibition effect of compounds on XG-7 cells by cell proliferation assays.
Notes: (A–C) show results of MTT, 3H-TdR and ATPlite assay, respectively. (D) The inhibition ratio of compound 1 by three different assays. NEG: NEG control (XG-7 cells with 2 ng/mL hIL-6), DMSO: DMSO control (XG-7 cells with hIL-6 and 0.1% DMSO) and POS: POS control (XG-7 cells without hIL-6). Represented data are mean ± SD (n=3). *P<0.05 and **P<0.01 vs DMSO control.
Abbreviations: MTT, 3-(4,5-dimethylthiazol-2-yl)-2,5-diphenyltetrazolium bromide; NEG, negative; DMSO, dimethyl sulfoxide; POS, positive; SD, standard deviation; OD, optical density; 3H-Tdr, 3H tritiated thymidine; CPM, counts per minute; CPS, counts per second.
Abbreviations: MTT, 3-(4,5-dimethylthiazol-2-yl)-2,5-diphenyltetrazolium bromide; NEG, negative; DMSO, dimethyl sulfoxide; POS, positive; SD, standard deviation; OD, optical density; 3H-Tdr, 3H tritiated thymidine; CPM, counts per minute; CPS, counts per second.
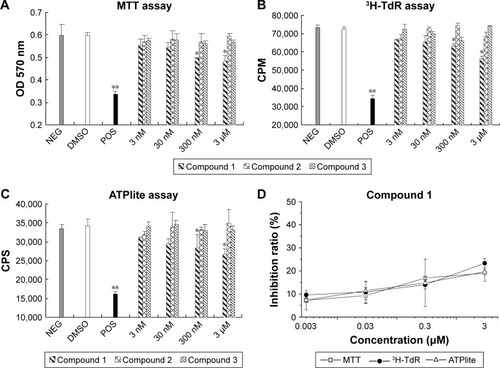
Figure 5 Compound 1 induced XG-7 cell apoptosis.
Notes: (A) Morphological analysis of compound 1-treated XG-7 cells stained with Giemsa. NEG: NEG control (XG-7 cells with hIL-6), DMSO: 0.1% DMSO control and POS: POS control (XG-7 cells without hIL-6) and XG-7 cells treated for 72 hours with 0.3 μM and 3 μM of compound 1, respectively. The apoptosis cells were marked out with black arrows. Magnification: ×600. (B) Compound 1 induced DNA fragmentation in XG-7 cells. XG-7 cells were treated with different concentrations of compound 1 for 72 hours in the presence or absence of hIL-6. DNA was isolated and examined with 2% agarose gel electrophoresis. Marker: DL-2000 ladders.
Abbreviations: NEG, negative; DMSO, dimethyl sulfoxide; POS, positive.
Abbreviations: NEG, negative; DMSO, dimethyl sulfoxide; POS, positive.
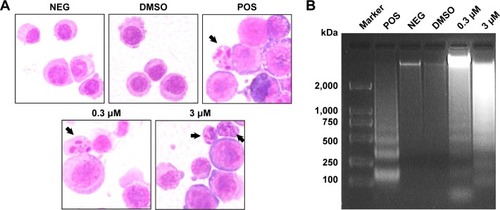
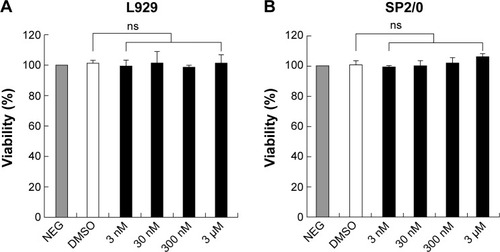
Figure 6 The detection of cytotoxic effect of compound 1 with MTT assay.
Notes: L929 cells (A) and SP2/0 cells (B) were treated with different concentrations of compound 1 for 72 hours. Average results from a triplex experiment are shown together with the mean ± SD values.
Abbreviations: MTT, 3-(4,5-dimethylthiazol-2-yl)-2,5-diphenyltetrazolium bromide; SD, standard deviation; NEG, negative; DMSO, dimethyl sulfoxide; ns, not significant.
Abbreviations: MTT, 3-(4,5-dimethylthiazol-2-yl)-2,5-diphenyltetrazolium bromide; SD, standard deviation; NEG, negative; DMSO, dimethyl sulfoxide; ns, not significant.