
Figures & data
Table 1 ADMET descriptor values in DS4.0 and their corresponding interpretations
Table 2 Binding energies, and ADMET predictions of ACM, and Enamine hit compounds
Figure 1 Preparation of 3D structure of Mycobacterium tuberculosis 7,8-diaminopelargonic acid aminotransferase: (A) 3D structure of 7,8-diaminopelargonic acid aminotransferase (BioA) of M. tuberculosis (LdtMt2, PDB ID: 3TFU)Citation27 (3D structure generated using: Protein Data Bank, www.rcsb.org);Citation28 (B) molecular overlay of raw (cyan) and minimized (yellow) crystal structures of BioA (RMSD =0.70 Å).
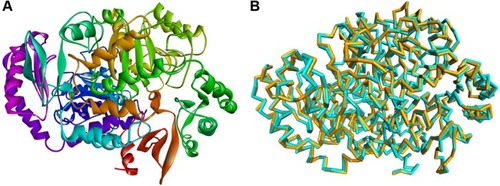
Figure 2 Structure-based pharmacophore model of BioA. This pharmacophore was modeled based on BioA’s active site, showing 9 hydrophobic (cyan), 9 donor (magenta), and 7 acceptor (green) features.
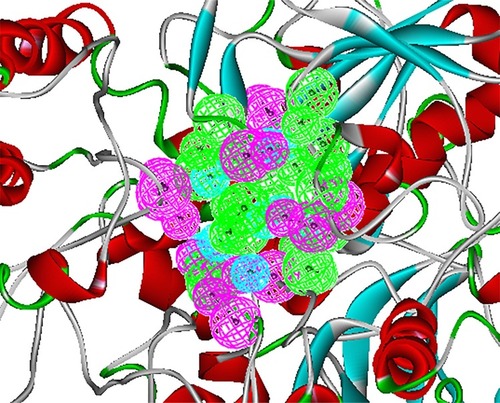
Figure 3 Comparison of the percentages of inhibition of H37Ra growth for 4 Enamine test compounds and rifampicin (positive control) at 10 μg/mL and 0.1 μg/mL. Results are shown as averages of ±SD of 4 independent experiments.
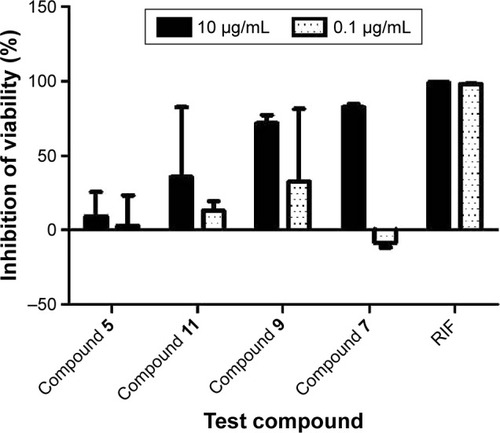
Figure 4 Chemical structures of bioactive hits.
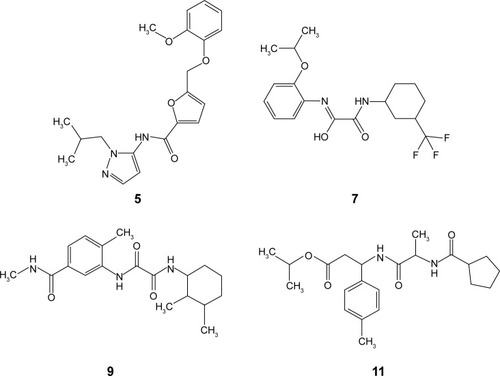
Figure 5 Interaction diagram for BioA–compound 7 complex. Interaction diagram legends include: 1) pink circles = residues involved in hydrogen bond, charge, or polar interactions; 2) green circles = residues involved in van der Waals interactions; 3) blue circles = water molecules; 4) blue dashed arrow directed toward the electron donor = hydrogen bonding with amino acid side chains; and 5) orange line with symbols = pi interactions.
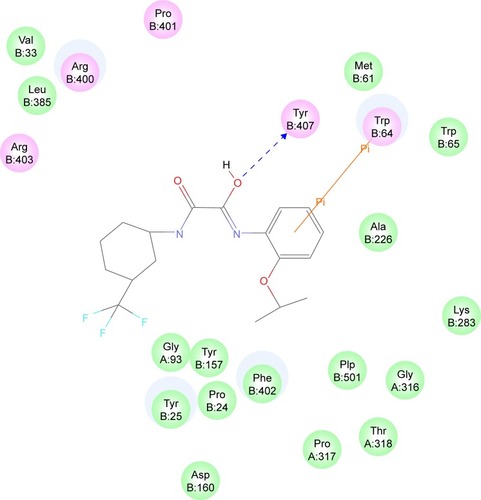
Figure 6 Binding mode of compound 7 in BioA active site. Compound 7 (cyan carbon atoms) and the key interacting residues (gray atoms) are shown in sticks. Hydrogen bonds are displayed as green dashed lines, while hydrophobic interactions are displayed as pink dashed lines, and pi-interaction pairs are connected by orange lines.
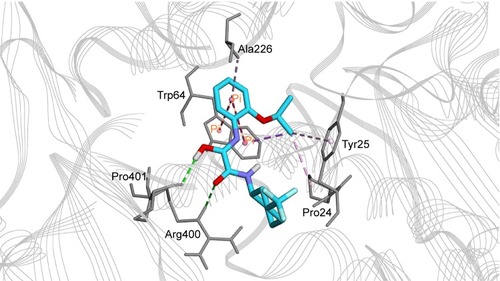
Table S1 Two-dimensional structures of the inhibitor ACM, as well as the top 17 Enamine compounds generated from in silico studies