
Figures & data
Table 1 Demographic and baseline characteristics at screening by renal function status and lesinurad dose
Table 2 Geometric mean (95% CI) plasma and urine pharmacokinetics of lesinurad by renal function status and lesinurad dose
Table 3 Geometric mean ratios (90% CI) of plasma and urine lesinurad pharmacokinetic parameters by renal function status and lesinurad dose
Figure 1 Median plasma concentration profiles of (A) lesinurad 200 mg or (B) lesinurad 400 mg in subjects with various degrees of renal function (semi-log scale).
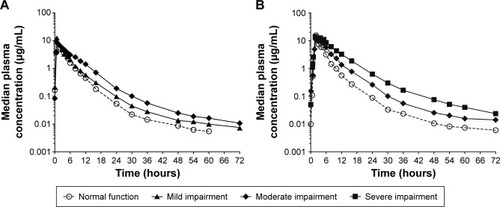
Figure 2 The relationship between renal function status and lesinurad PK parameters.
Abbreviations: PK, pharmacokinetics; AUC, area under the plasma concentration–time curve; CL, clearance of lesinurad; Cmax, maximum observed plasma concentration.
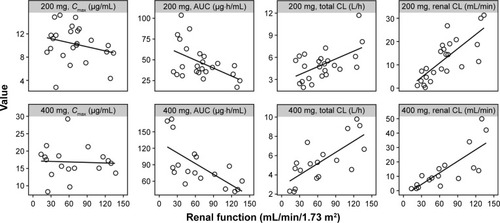
Figure 3 Mean (SE) percent change from baseline (time-matched Day 1) in serum concentrations of uric acid within 24 hours post-dose in subjects with normal renal function, mild, moderate, or severe renal impairment following a single dose of (A) lesinurad 200 mg or (B) lesinurad 400 mg.
Abbreviation: SE, standard error.
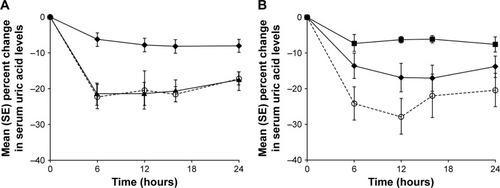
Table 4 Mean (SE) urinary uric acid pharmacodynamic parameters by renal function status and lesinurad dose