Figures & data
Figure 1 Saliva flow rate (μL/min/100 g) after a single application of DM-formulations in normal rats.
Abbreviations: SD, standard deviation; min, minute; DM-sol, DM solution.
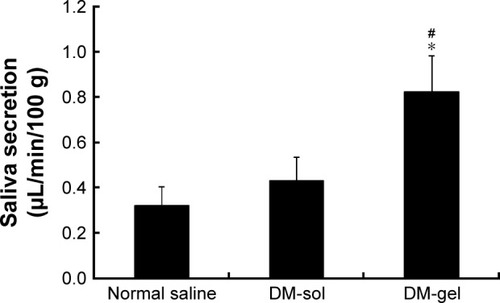
Table 1 Mean inhibition zone diameters (mm) of DM-formulations against S. aureus, C. albicans, and A. viscosus
Figure 2 Histological observation of the buccal mucosa.
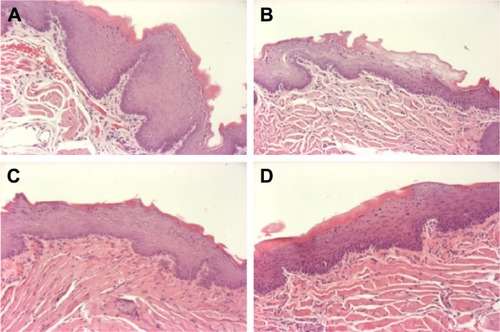
Figure 3 Histopathological scores of the buccal mucosa after repeated application of 1) vehicle, 2) DM-sol, and 3) DM-gel for 4 weeks in diabetic mice with hyposalivation.
Abbreviations: SD, standard deviation; DM-sol, DM solution.
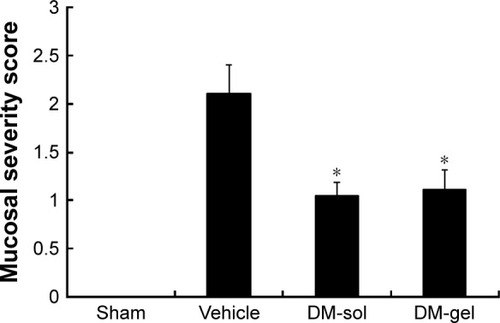
Figure 4 Changes in buccal mucosa thickness after repeated application of 1) vehicle, 2) DM-sol, and 3) DM-gel for 4 weeks in diabetic mice with hyposalivation. Vertical bars represent ± SD (n=7−8). Statistical analysis was performed using Student’s t-test; *P<0.05 versus vehicle.
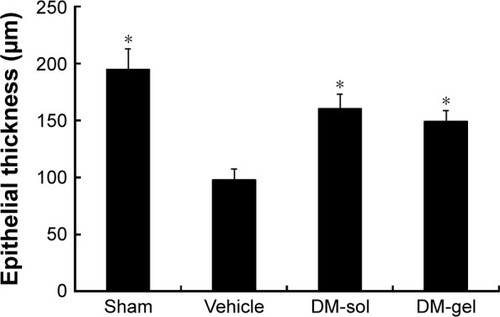
Figure 5 Histological observation of the gingival gingiva.
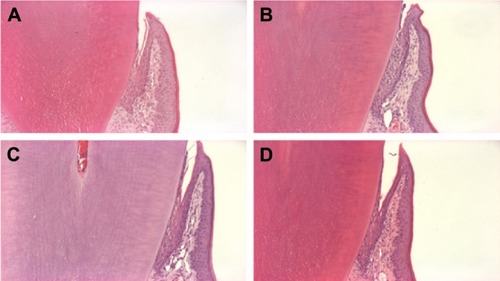
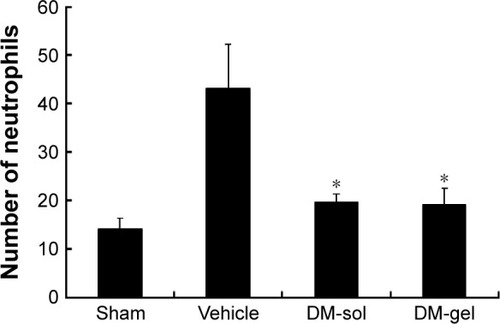
Figure 6 Neutrophil levels in the gingival gingiva of 1) normal mice and diabetic mice with hyposalivation after repeated application of 2) vehicle, 3) DM-sol, and 4) DM-gel for 4 weeks.
Abbreviations: SD, standard deviation; DM-sol, DM solution.