Figures & data
Figure 1 1H NMR and chemical structures of 8-hydroxy-ar-turmerone.
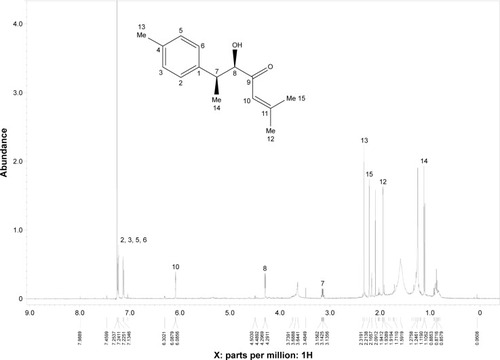
Table 1 1H NMR (500 MHz) and 13C NMR (125 MHz) spectral data of 8-hydroxy-ar-turmerone in CDCl3 (δ in ppm, J in Hz)
Table 2 KME and 8-hydroxy-ar-turmerone were tested against MCF7, LA7 and MCF10A cell lines
Figure 2 Cytotoxicity effect of KME against different cell lines.
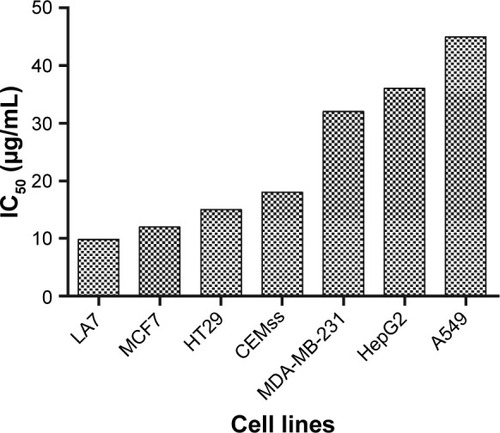
Table 3 Reduction in tumor size in the high dose KME and tamoxifen-treated groups
Figure 3 Breast cancer tumor volume in different groups.
Abbreviations: HD, high dose; KME, Kelussia odoratissima methanol extract; LD, low dose; NC, normal control; SEM, standard error of the mean; TC, tumor control; TT + HD, tumor treated with HD KME; TT + LD, tumor treated with LD KME; TT + TAM, tumor treated with tamoxifen.
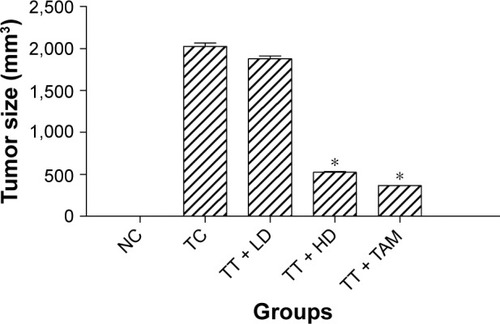
Figure 4 Histological examination of breast cancer tissue.
Abbreviations: HD, high dose; KME, Kelussia odoratissima methanol extract; LD, low dose.
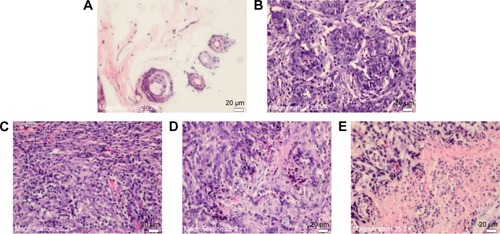
Figure 5 Apoptosis confirmation using the TUNEL assay.
Abbreviations: HD, high dose; KME, Kelussia odoratissima methanol extract; LD, low dose.
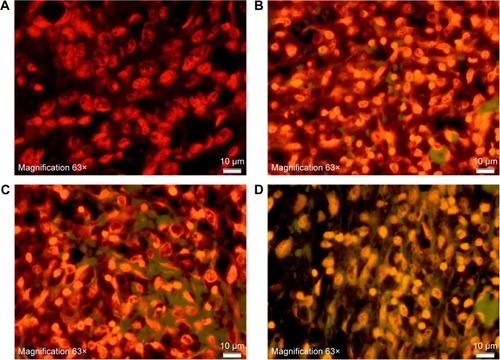
Figure 6 Immunohistochemical analysis of tumor proliferation markers.
Abbreviations: HD, high dose; KME, Kelussia odoratissima methanol extract; LD, low dose; SEM, standard error of the mean; TC, tumor control; TT + HD, tumor treated with HD KME; TT + LD, tumor treated with LD KME; TT + TAM, tumor treated with tamoxifen.
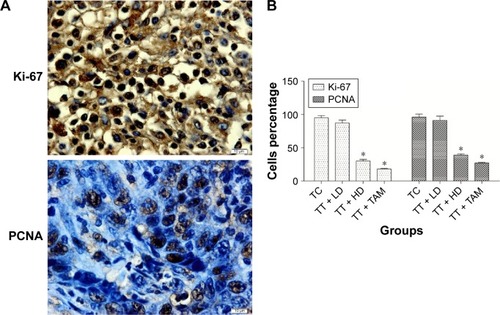
Figure 7 Immunohistochemical results of apoptotic markers.
Abbreviations: HD, high dose; KME, Kelussia odoratissima methanol extract; LD, low dose.
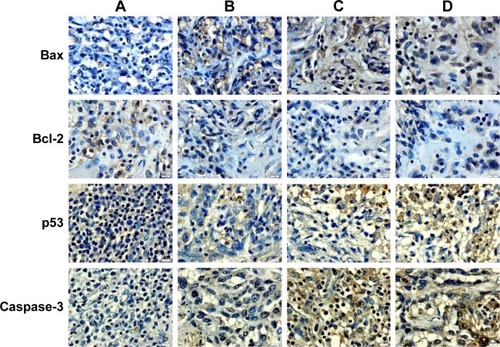
Figure 8 Immunohistochemical study of cell cycle markers.
Abbreviations: HD, high dose; KME, Kelussia odoratissima methanol extract; LD, low dose.
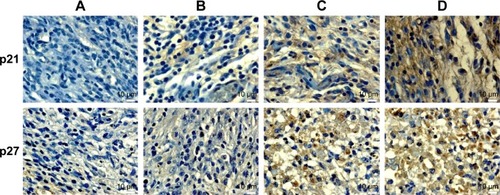
Figure 9 Early apoptosis validation.
Abbreviations: FITC, fluorescein isothiocyanate; IC50, half maximal inhibitory concentration.
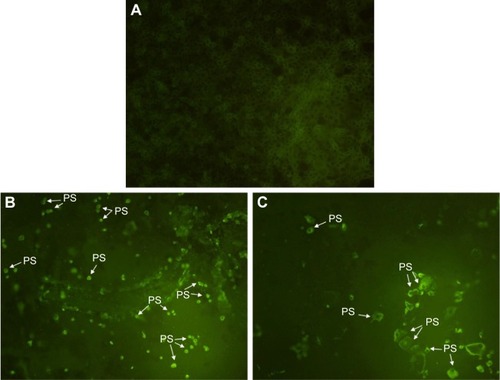
Figure 10 Caspase-9 and caspase-7 luminescence evaluation in MCF7 cells during 8-hydroxy-ar-turmerone treatment.
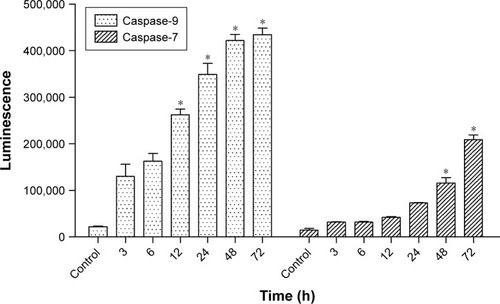
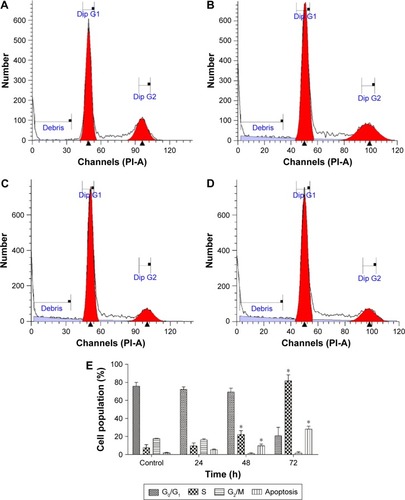
Figure 11 Flow cytometric analysis of cell cycle distribution in MCF7 cell line.
Abbreviations: IC50, half maximal inhibitory concentration; PI-A, propidium iodide A channel.