Figures & data
Table 1 Subjects’ demographics (mean ± standard deviation)
Table 2 Study design
Table 3 Analysis information
Table 4 Comparison of the tested models
Figure 1 Goodness-of-fit plots for the final population transit compartment PK model for pregabalin.
Note: Black line, line of identity; gray line, LOESS line.
Abbreviations: CWRES, conditional weighted residuals; IWRES, individual weighted residuals; PK, pharmacokinetic; LOESS, locally weighted scatterplot smoothing.
Abbreviations: CWRES, conditional weighted residuals; IWRES, individual weighted residuals; PK, pharmacokinetic; LOESS, locally weighted scatterplot smoothing.
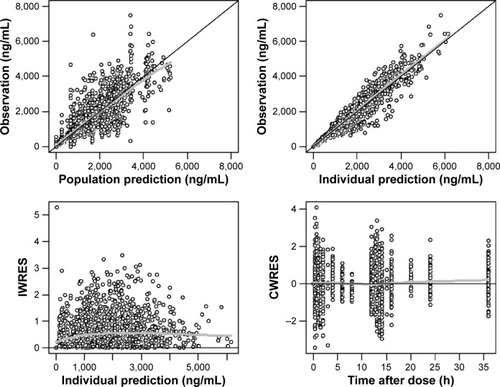
Figure 2 CWRES of first-order absorption model and transit compartment model at peak concentrations (left) and trough concentrations (right).
Abbreviation: CWRES, conditional weighted residuals.
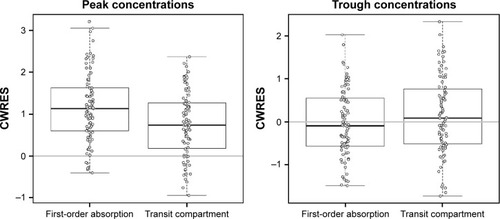
Table 5 Final estimates of population PK parameters
Figure 3 VPC plots for the first-order absorption model (red line) and transit compartment model (blue line) of study 3 (A), study 5 (B), study 2 (C), and study 1 and study 4 (D).
Notes: (A) day 1 (fasted and fed), (B) day 1 (both fed), (C) steady state (fasted and fed), and (D) steady state (both fed). Open circle, observed concentration; solid line, median; dashed line, fifth and 95th percentiles; and gray areas, 90% CIs of observed concentrations.
Abbreviations: VPC, visual predictive check; CI, confidence interval.
Abbreviations: VPC, visual predictive check; CI, confidence interval.
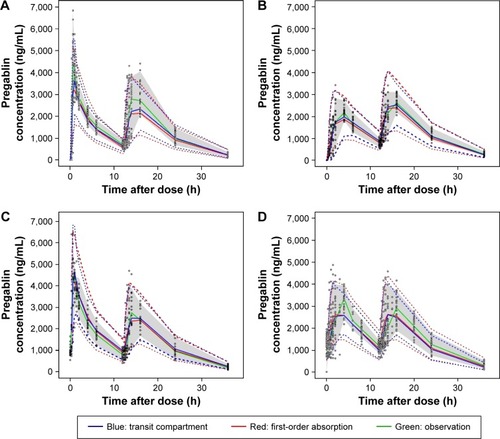
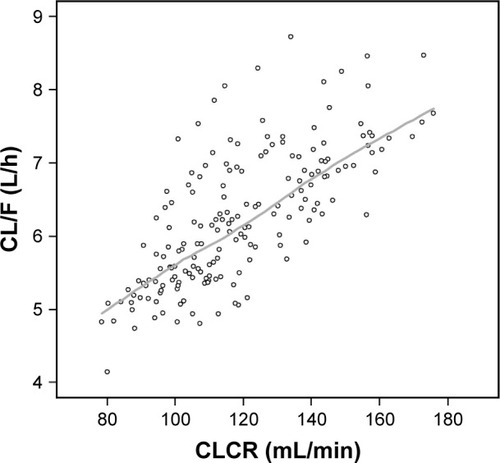
Figure 4 Scatterplot of CLCR and estimated CL/F of pregabalin.
Note: Gray line, LOESS line.
Abbreviations: CLCR, creatinine clearance; CL/F, apparent clearance; LOESS, locally weighted scatterplot smoothing.
Abbreviations: CLCR, creatinine clearance; CL/F, apparent clearance; LOESS, locally weighted scatterplot smoothing.