Figures & data
Figure 1 (A) Chemical structure of SMA; (B) SMA self-assembly at pH 7 in aqueous solution.
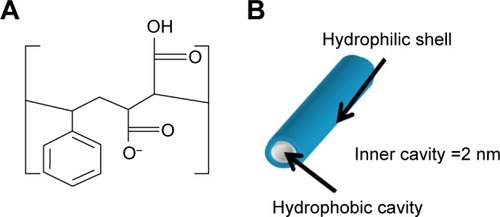
Figure 2 Molecular modeling and transmission electron microscopy characterization of the self-assembled structure of SMA at (A) low molecular weight and (B) high molecular weight. Adapted with permission of Taylor & Francis, from Molecular Simulation, Characterization of a novel self-association of an alternating copolymer into nanotubes in solution, Malardier-Jugroot C, van de Ven TGM, Whitehead MA, 31, 2–1, 2005; permission conveyed through Copyright Clearance Center, Inc.,Citation45 and adapted from Chemical Physics Letters, 636, McTaggart M, Malardier-Jugroot C, Jugroot M, Self-assembled biomimetic nanoreactors I: polymeric template, 206–220, Copyright (2015), with permission from Elsevier.Citation46
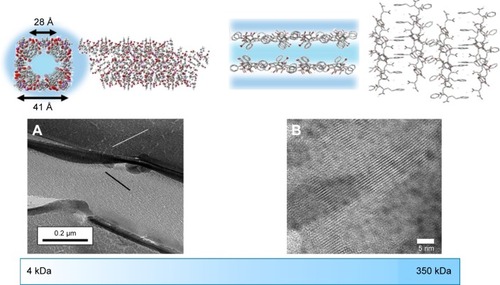
Figure 3 FA-DABA-PSMA oligomer at pH 7 at #1 carboxylic acid using ONIOM model: central trimer optimized to DFT, outer two to PM6. Adapted with permission from Biophy Chem, 214–215, Li X, McTaggart M, Malardier-Jugroot C, Synthesis and characterization of a pH responsive folic acid functionalized polymeric drug delivery system, 17–26. Copyright (2016), with permission from Elsevier.Citation16
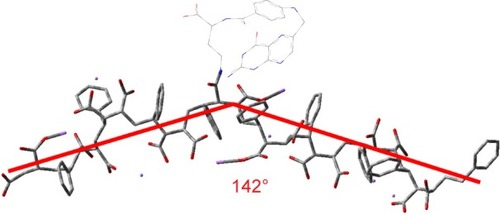
Figure 4 Schematic representation of FA-DABA-SMA in its “off” state and “on” state.
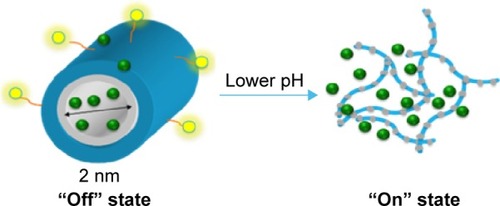
Figure 5 Dynamic light scattering results of (A) pure 0.05 wt% SMA solution and (B) 1 wt% PSMA-DABA-FA with mean zeta potential of −39.89 mV.
Abbreviations: DABA, biodegradable linker 2,4-diaminobutyric acid; FA, folic acid; SMA, poly(styrene-alt-maleic anhydride).
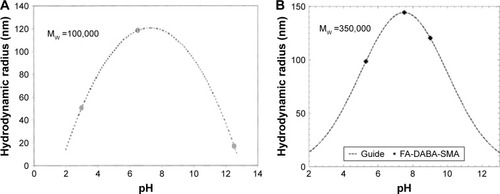
Figure 6 Chemical structure of curcumin and fluorescence intensity of curcumin in water and when encapsulated in SMA polymers (PSMA) (1% wt to water) at excitation wavelength 420 nm.
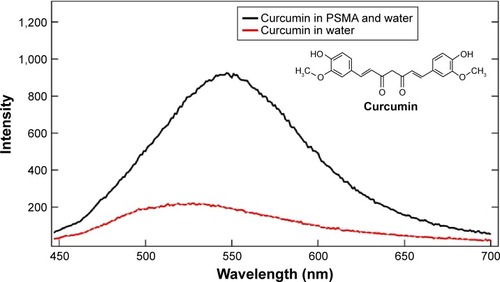
Figure 7 Fluorescent images showing cellular uptake of curcumin-loaded SMA in (A) RAW-Blue and (B) PANC-1 cell lines.
Abbreviations: SMA, poly(styrene-alt-maleic anhydride); Cur, curcumin.
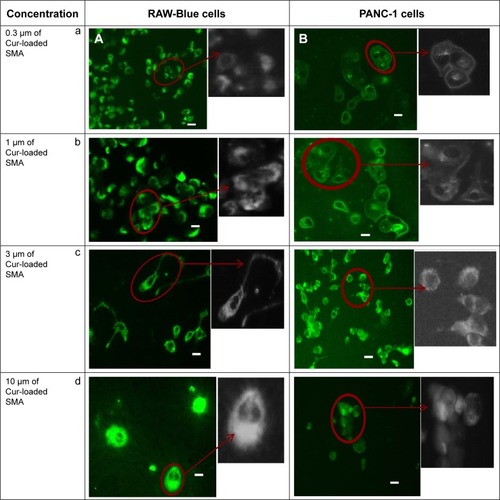
Figure 8 Fluorescent images showing cellular uptake of curcumin-loaded FA-DABA-SMA in (A) RAW-Blue and (B) PANC-1 cell lines.
Abbreviations: SMA, poly(styrene-alt-maleic anhydride); Cur, curcumin.
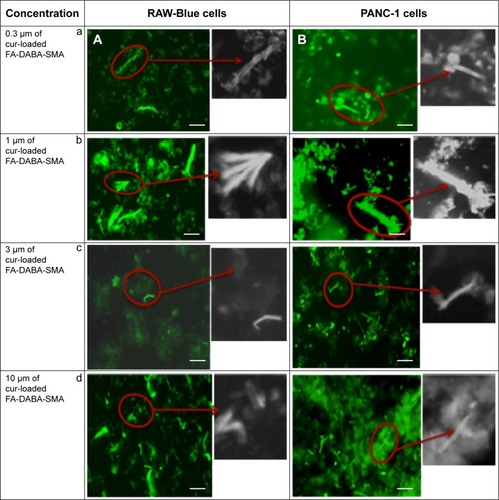
Figure 9 Viability of PANC-1 cells treated with empty SMA at different doses using the WST-1 assay.
Abbreviations: SMA, poly(styrene-alt-maleic anhydride); SEM, standard error of mean.
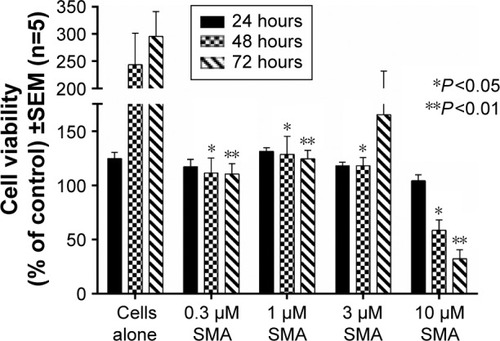
Figure 10 Viability of PANC-1 cells treated with empty FA-DABA-SMA at different doses using the WST-1 assay.
Abbreviations: SMA, poly(styrene-alt-maleic anhydride); SEM, standard error of mean.
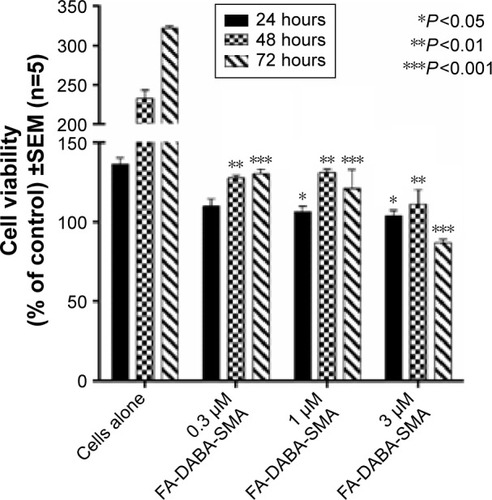
Figure 11 Viability of PANC-1 cells treated with Cur-encapsulated FA-DABA-SMA at different doses using the WST-1 assay.
Abbreviations: SMA, poly(styrene-alt-maleic anhydride); Cur, curcumin; SEM, standard error of mean.
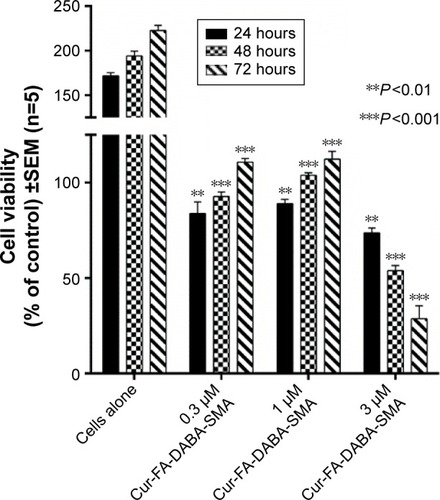
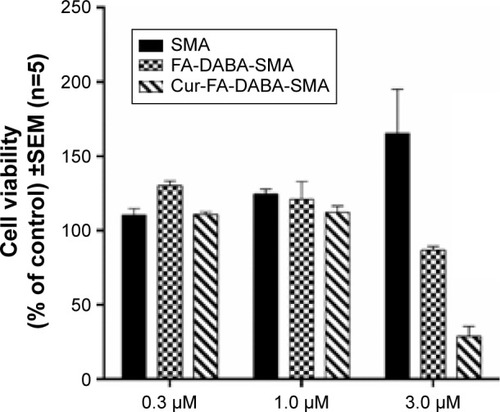
Figure 12 Comparison of viability of PANC-1 cells at 72 hours treated with SMA, FA-DABA-SMA, and Cur-encapsulated FA-DABA-SMA at different doses using the WST-1 assay (n=5).