Figures & data
Figure 1 Structural similarity of N-[2(3-carboxyl-9-benzyl/H-carboline-1-yl)ethyl-1-yl]-amino acids, BPIC, PZL318, NRCB and HMCEF.
![Figure 1 Structural similarity of N-[2(3-carboxyl-9-benzyl/H-carboline-1-yl)ethyl-1-yl]-amino acids, BPIC, PZL318, NRCB and HMCEF.](/cms/asset/a243e4ad-a14c-4841-a696-5577b63a9286/dddt_a_123919_f0001_b.jpg)
Figure 2 Docking feature of HMCEF in the active site of d(CGATCG)2.
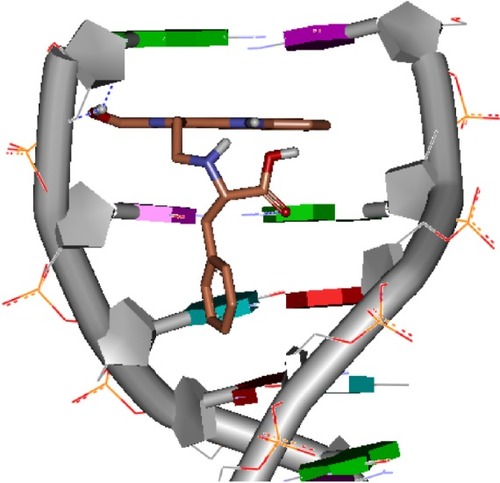
Figure 3 Absorbance changes after interaction of HMCEF and CT DNA.
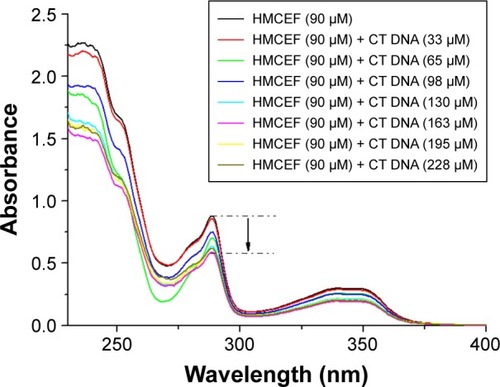
Figure 4 Fluorescence spectra of HMCEF.
Abbreviations: CT DNA, calf thymus DNA; EB, ethidium bromide; HMCEF, N-(3-hydroxymethyl-β-carboline-1-yl-ethyl-2-yl)-l-Phe; PBS, phosphate-buffered saline.
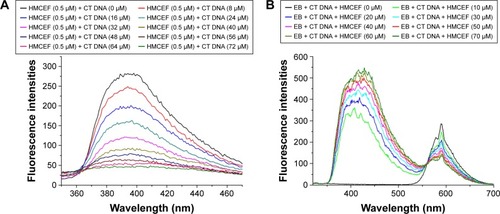
Figure 5 CD spectra of CT DNA in the absence (curve a) and presence of HMCEF (curve b) at (HMCEF)/(CT DNA) value of 2.0.
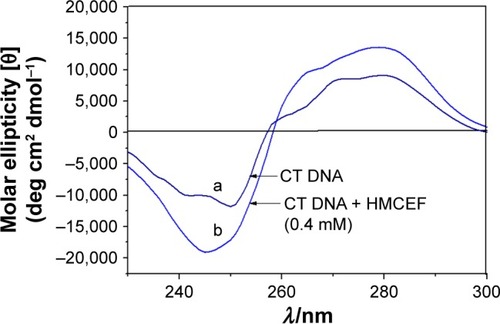
Figure 6 Thermal denaturation curves of CT DNA with and without HMCEF.
Note: Tm measurements were performed in PBS at pH 7.4 with HMCEF/DNA ratio of 4.34; A0 is the initial absorbance. Af is the final absorbance, and A is the absorbance at any temperature.
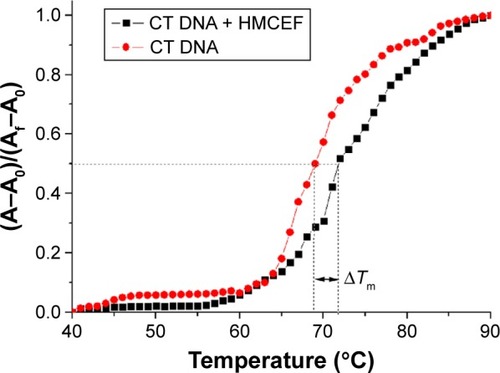
Figure 7 Effect of increasing amounts of HMCEF on the relative viscosity of CT DNA at 30°C.
Notes: η is the viscosity of DNA in the presence of HMCEF; η0 is the absence of HMCEF; CHMCEF is the concentration of HMCEF; and CCT DNA is the concentration of CT DNA.
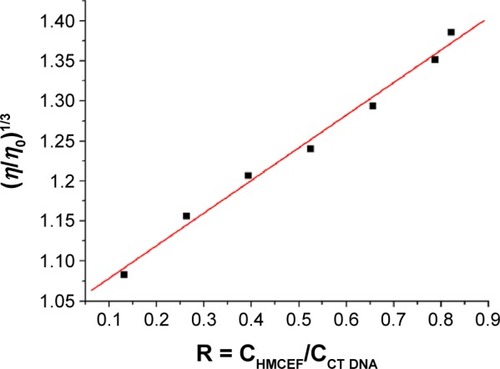
Figure 8 Electrophoretogram of supercoiled DNA plasmid pBR322 and HMCEF treated plasmid pBR322 DNA.
Abbreviation: HMCEF, N-(3-hydroxymethyl-β-carboline-1-yl-ethyl-2-yl)-l-Phe.
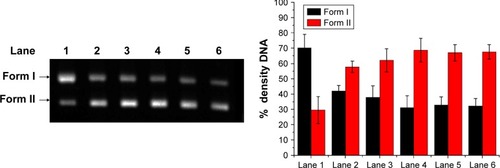
Figure 9 FT-MS, qCID and ROESY 2D NMR spectra, as well as the conformation of HMCEF.
Abbreviations: FT-MS, Fourier transform mass spectrometry; HMCEF, N-(3-hydroxymethyl-β-carboline-1-yl-ethyl-2-yl)-l-Phe; Intens, intensity; NMR, nuclear magnetic resonance; qCID, qualitative contingent influence diagram; ROESY, rotating-frame Overhauser effect spectroscopy.
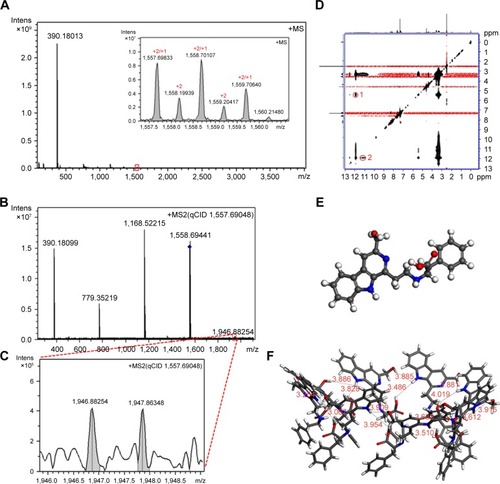
Figure 10 TEM, SEM and AFM images of HMCEF, as well as the prediction of a nanoparticle of 10.7 nm in diameter by mesoscale simulation.
Abbreviations: AFM, atomic force microscopy; HMCEF, N-(3-hydroxymethyl-β-carboline-1-yl-ethyl-2-yl)-l-Phe; SEM, scanning electron microscopy; TEM, transmission electron microscopy.
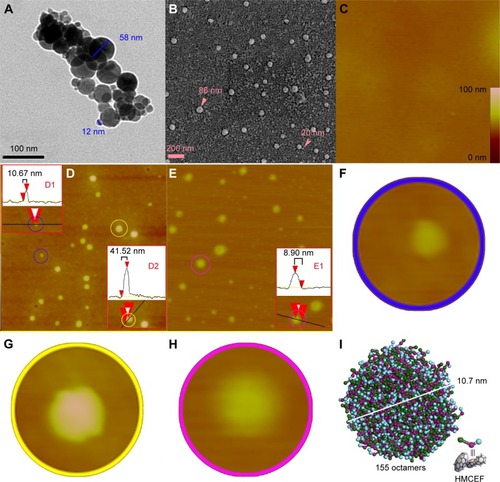
Figure 11 HMCEF inhibits A549 cell-induced platelet aggregation in vitro.
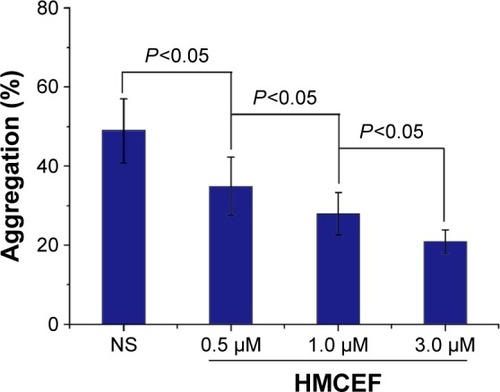
Figure 12 IC50 of HMCEF against Bel7402, HeLa, HepG2 and K562 cells and HMCEF dose-dependent inhibition of tumor growth in S180 mice.
Abbreviations: HMCEF, N-(3-hydroxymethyl-β-carboline-1-yl-ethyl-2-yl)-l-Phe; IC50, half maximal inhibitory concentration.
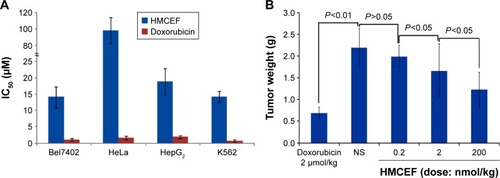
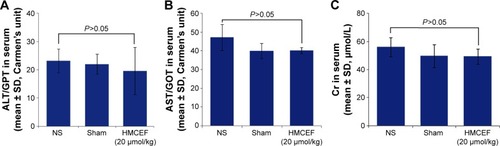
Figure 13 Serum ALT, AST and Cr of S180 mice treated with 200 nmol/kg per day of HMCEF or NS for 10 consecutive days, n=12.
Abbreviations: ALT, alanine transaminase; AST, aspartate transaminase; Cr, creatinine; GOT, glutamic oxaloacetic transaminase; GPT, glutamic pyruvic transaminase; HMCEF, N-(3-hydroxymethyl-βcarboline-1-yl-ethyl-2-yl)-l-Phe; NS, normal saline.
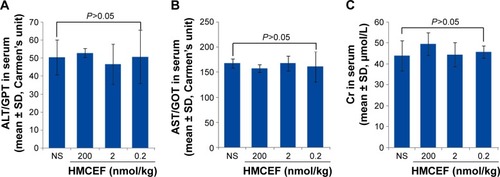
Figure 14 Serum ALT, AST and Cr of healthy ICR mice treated with 200 nmol/kg of HMCEF or NS, n=12.
Abbreviations: ALT, alanine transaminase; AST, aspartate transaminase; Cr, creatinine; GOT, glutamic oxaloacetic transaminase; GPT, glutamic pyruvic transaminase; HMCEF, N-(3-hydroxymethyl-β-carboline-1-yl-ethyl-2-yl)-l-Phe; NS, normal saline.