Figures & data
Table 1 In vitro cellular uptake of OCP-L with different OMI concentrations against A549/CDDP cells after 48 h
Figure 1 (A) In vitro cellular uptake of OCP-L with different OMI concentrations against A549/CDDP cells after 48 h. (B)-High–content analysis images of A549/CDDP cells after incubating with Dir-labeled OCP-L (magnification 400-fold). Data are presented as the mean ± standard deviation. ***P<0.001. The OCP-L was labeled with Dir (green), and nucleus (blue) was stained by DAPI.
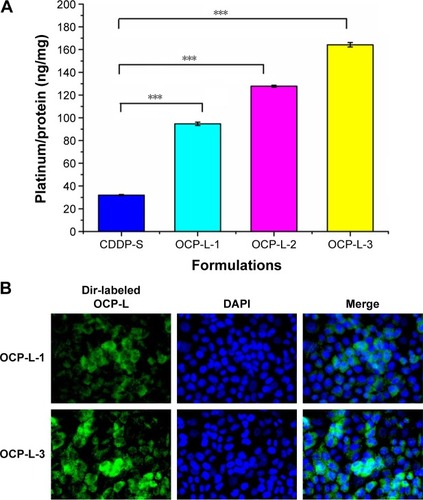
Figure 2 (A) Total cellular platinum concentration in A549/CDDP cells after incubation with OCP-L-3 or CDDP-S at different time points. Data are presented as the mean ± standard deviation. (B) Relative cellular uptake of Dir-labeled OCP-L in A549/CDDP cells after 2 h of incubation at CDDP concentration of 32 μM in the presence of the specific endocytosis inhibitors was compared with that in the absence of specific endocytosis inhibitors (control). (C) Apoptosis of A549/CDDP cells induced by 32 μM CDDP-S or OCP-L after 48 h of incubation was determined using the Annexin V-APC/7-AAD staining. Each quadrant represents the percentage of cells in early apoptosis (lower right), late apoptosis (upper right), necrosis (upper left), and healthy cells (lower left), respectively.
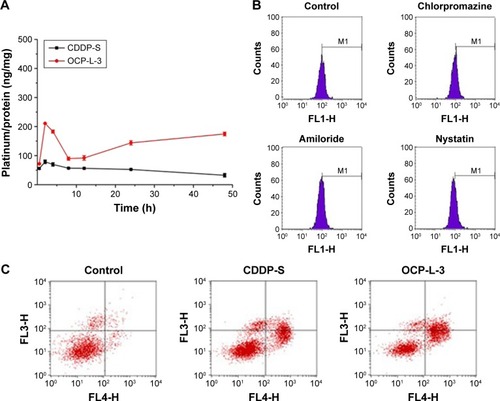
Figure 3 (A) Determination of OCT2 and ATP7B expression in A549/CDDP cells after treatment with CDDP-S, OP-L, and OCP-L for 48 h. (B) HIF-1α, Akt, and p-Akt expressions on the A549/CDDP cells after treatment with CDDP-S, OP-L, and OCP-L for 48 h. (C) Relative protein level of OCT2 and ATP7B. (D) Relative protein level of HIF-1α, Akt, and p-Akt. Expressions of OCT2, ATP7B, HIF-1α, Akt, and p-Akt were determined by Western blot. GAPDH and β-actin were used for equal loading. Data are presented as the mean ± standard deviation (n=2). *P>0.05, **P<0.05, ***P<0.01.
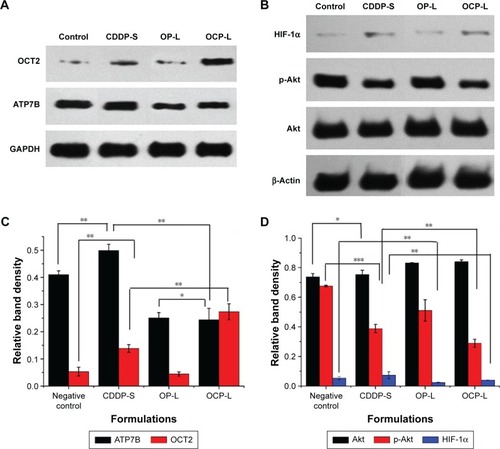
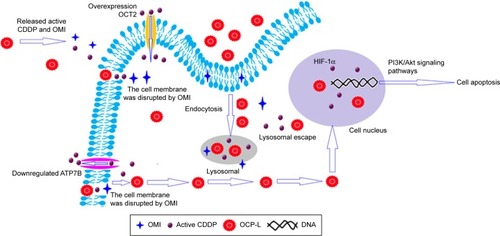
Figure 4 Possible mechanisms for overcoming resistance in A549/CDDP cells using OCP-L.