Figures & data
Table 1 Compound structures and IC50 values in the biochemical HDAC assays
Figure 1 Dose-dependent inhibition of HDACs by ebselen (A), ebselen oxide (B), Thr101 (C), and RBC-2008 (D) in a biochemical assay. The activity against all the 11 HDACs was assessed by using the acetylated AMC-labeled peptide substrates. HDAC enzyme was incubated with test compound for 10 min, and then, the substrate was added to start the reaction. After the reaction was completed, a developer was added to digest the deacetylated substrate, and the fluorescence generated was detected with excitation (Ex) at 360 nM and emission (Em) at 460 nM by using the EnVision Multilabel Plate Reader (PerkinElmer, Santa Clara, CA, USA). The IC50 curves were plotted, and IC50 values were calculated by using the GraphPad Prism 4 program based on a sigmoidal dose–response equation. Data shown here represent one of three independent experiments.
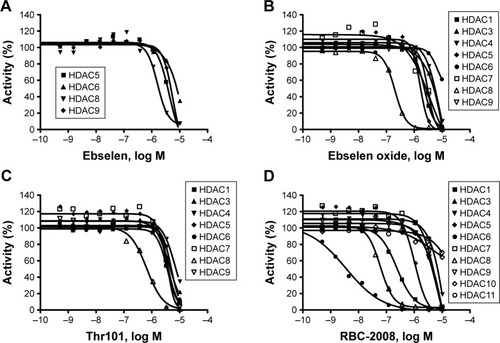
Table 2 Effects of ebselen and ebsulfur analogs on SIRT functional activities
Figure 2 Mechanisms of HDAC inhibition by RBC-2008.
Abbreviations: DMSO, dimethyl sulfoxide; HDAC, histone deacetylase.
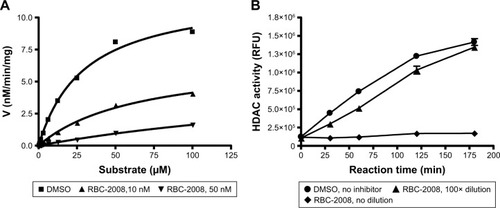
Figure 3 Modulation of α-tubulin acetylation by RBC-2008 in PC-3 cells.
Abbreviations: DMSO, dimethyl sulfoxide; HDAC, histone deacetylase.
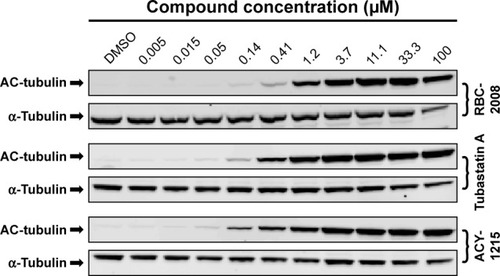
Table 3 Activities of compounds on human tumor cell viability
Figure 4 Effects of RBC-2008 on the human tumor cell viability in CellTiter-Glo® assay. Approximately 1,000 of U266 cells, REH cells, K562 cells, KMS-11 cells, RPMI-8226 cells, and MM.1S cells were incubated with the indicated concentrations of RBC-2008 in 384-well assay plates at 37°C, 5% CO2 for 72 h. Then, 25 µL of CellTiter-Glo® reagent was added to the wells of the assay plates and incubated at a room temperature for 10 min with gentle shaking. The luminescent signal within plates were measured by using EnVision Multilabel Reader. The IC50 curves were plotted, and the IC50 values were calculated by using the GraphPad Prism 4 program based on sigmoidal dose–response equation. The IC50 values of RBC-2008 were calculated to be 14.5 µM, 1.8 µM, 13.1 µM, 2.5 µM, 3.8 µM, and 2.1 µM on U266 cells, REH cells, K562 cells, KMS-11 cells, RPMI-8226 cells, and MM.1S cells, respectively. Data shown here represent one of three independent experiments.
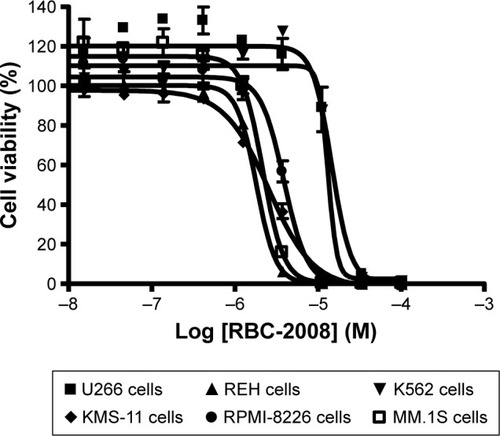
Figure S1 1H NMR spectrum for RBC-2008.
Abbreviation: NMR, nuclear magnetic resonance.
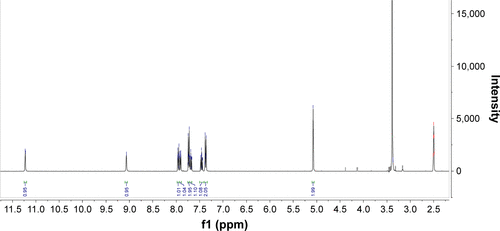
Figure S2 13C PENDANT NMR spectrum for RBC-2008.
Abbreviation: NMR, nuclear magnetic resonance.
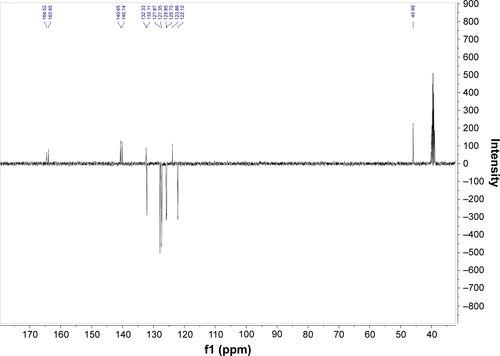
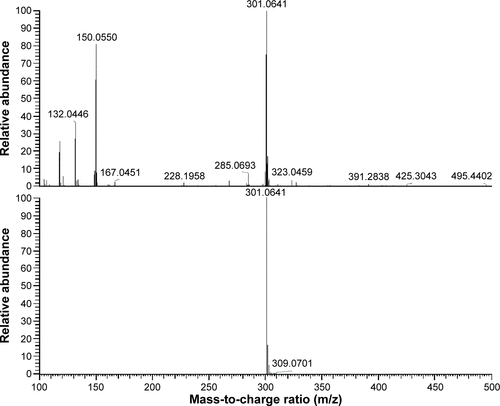
Figure S3 Matrix-assisted ionization-high-resolution mass spectrum for RBC-2008.
Note: Predicted spectrum for C15H12N2O3S+H is shown at the bottom.