Figures & data
Figure 1 Determination of the mean hydrodynamic diameter (Z-Ave) (d.nm) and polydispersity index versus time in days (mean ± standard deviation; n=3).
Note: a–dDifferent letters in each column indicate that the differences between means were statistically significant (P<0.05).
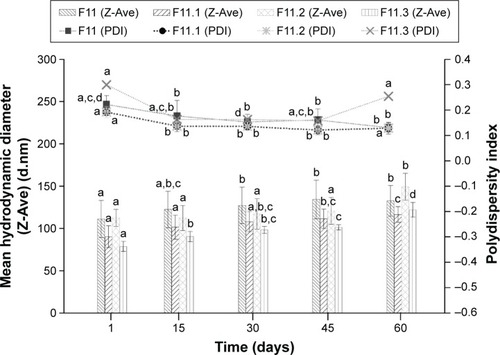
Figure 2 Values of zeta potential (mV) versus time in days (mean ± standard deviation; n=3).
Note: a–cDifferent letters in each column indicate a statistically significant difference between means (P<0.05).
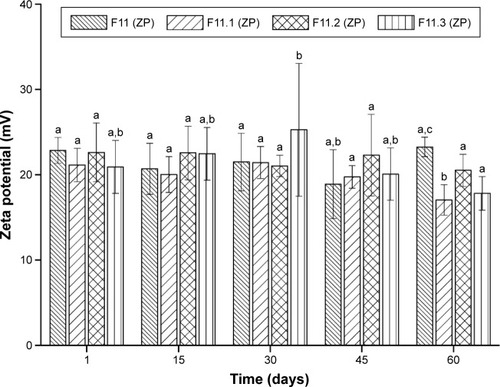
Table 1 NLC components
Table 2 Values expressed as mean ± SD of the mean hydrodynamic diameter and PDI of the NLCs developed (n=3)
Figure 3 Two-dimensional images of photomicrographs of NLCs: (A) F11, (B) F11.1, (C) F11.2, and (D) F11.3.
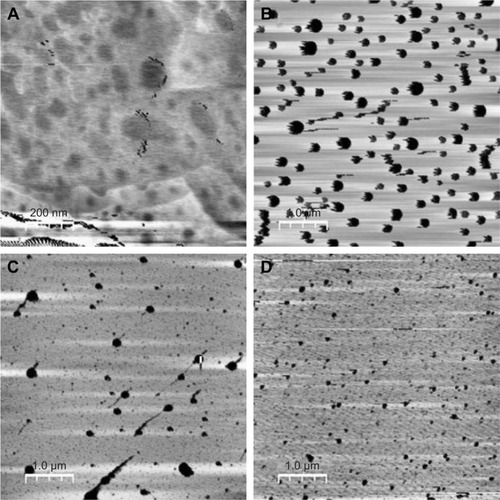
Figure 4 DSC scans of free copper(II) complexes 1, 2, and 3 and the components used in preparation of NLCs: (A) polyoxyl-40 hydrogenated castor oil (PEG-40); (B) cetyltrimethylammonium bromide (CTAB); (C) [CuCl2(INH)2]·H2O (1); (D) [Cu(NCS)2(INH)2]·5H2O (2); (E) [Cu(NCO)2(INH)2]·4H2O (3); (F) poloxamer 407 (P-407); (G) polyoxyethylene 40 stearate (E-40); (H) caprylic/capric triglyceride (CCTG).
![Figure 4 DSC scans of free copper(II) complexes 1, 2, and 3 and the components used in preparation of NLCs: (A) polyoxyl-40 hydrogenated castor oil (PEG-40); (B) cetyltrimethylammonium bromide (CTAB); (C) [CuCl2(INH)2]·H2O (1); (D) [Cu(NCS)2(INH)2]·5H2O (2); (E) [Cu(NCO)2(INH)2]·4H2O (3); (F) poloxamer 407 (P-407); (G) polyoxyethylene 40 stearate (E-40); (H) caprylic/capric triglyceride (CCTG).](/cms/asset/31b57270-fc36-4e00-b175-c881b2f7f554/dddt_a_127048_f0004_b.jpg)
Table 3 Melting points of the NLC components: E-40, CCTG, PEG-40, P-407, and CTAB
Figure 5 DSC scans of the F11 NLC and copper(II) complex-loaded NLCs, (A) F11, (B) F11.1, (C) F11.2, and (D) F11.3.
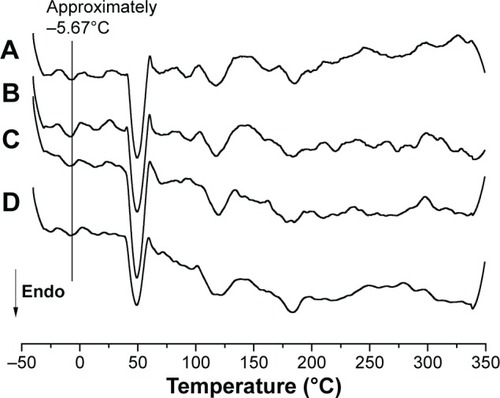
Table 4 In vitro antimicrobial activities of the free copper(II) complexes and those loaded into the NLCs expressed as the MIC values (μg/mL and μmol/L)
Figure 6 Percentage survival of Swiss mice over 14 days after a single administration of free copper(II) complexes 1, 2, and 3 and of those administered copper(II) loaded into the F11 NLC and SO, via gavage at a dose of 1,000 mg/kg bodyweight.
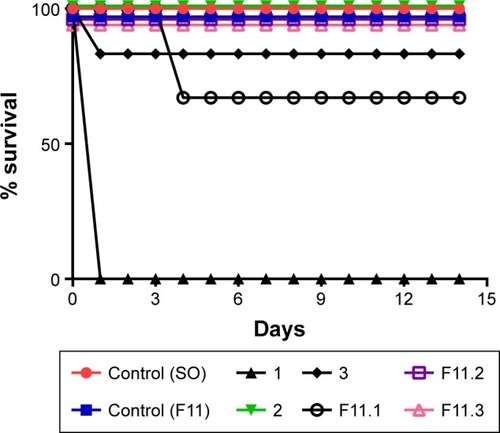
Figure 7 Percentage survival of Swiss mice over 14 days after a single administration of free copper(II) complex 1 via gavage at a dose of 500 mg/kg bodyweight.
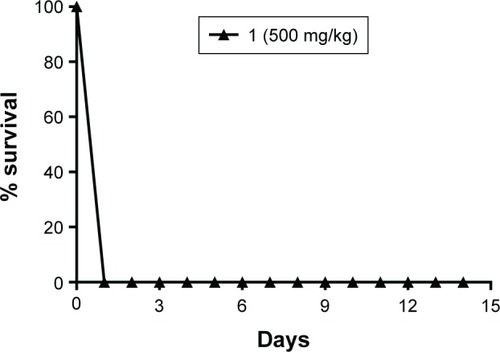
Figure 8 Percentage survival of Swiss mice over 14 days after a single administration of free copper(II) complex 1 via gavage at a dose of 300 mg/kg bodyweight.
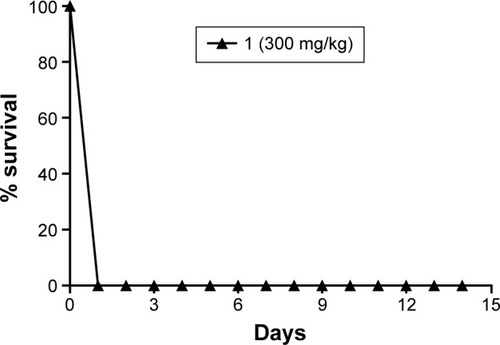
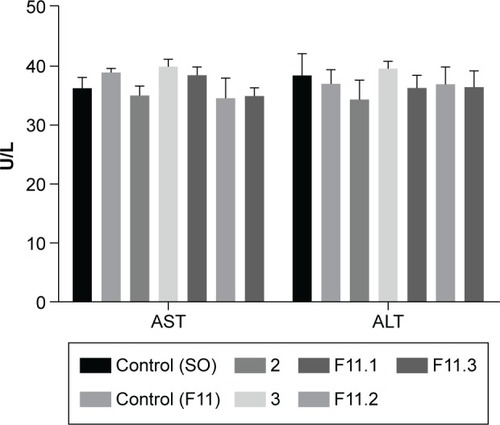
Figure 9 Quantification of the serum aspartate aminotransferase (AST) and alanine aminotransferase (ALT) activity levels in Swiss mice in terms of units per liter (U/L). The differences between the means were not statistically significant (P>0.05).