Figures & data
Table 1 Independent variables and their levels
Table 2 Experimental matrix containing run parameters and conditions for the preparation of CUR-DOX-LCL
Table 3 Experimental data for the studied dependent variables
Figure 1 Summary of fit for the models.
Abbreviations: CUR, curcumin; DOX, doxorubicin.

Table 4 Statistical parameters – one-way analysis of variance test for studied responses
Figure 2 Regression coefficient plots showing the influence of formulation factors on the encapsulated CUR concentration (A), the encapsulated DOX concentration (B), the EE for CUR (C), the EE for DOX (D), the size of the liposomes (E) and the zeta potential of the liposomes (F).
Abbreviations: CUR, curcumin; DOX, doxorubicin.
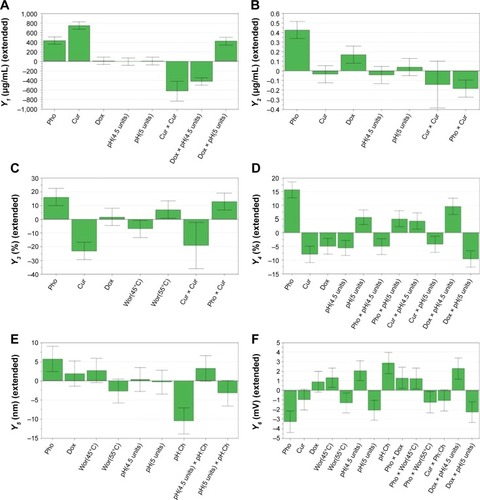
Figure 3 Contour plots showing the interaction between variables on the responses: the effect of X1X2 on entrapped CUR concentration, at 55°C and pH 5 (A); the effect of X1X2 on entrapped DOX concentration, at 55°C and pH 5 (B); the effect of X1X2 on CUR entrapment efficiency, at 55°C and pH 5 (C); the effect of X1X3 on DOX entrapment efficiency, at 55°C and pH 4.5 (D) and 5 (E); the effect of X1X3 on zeta potential, at 55°C and pH 4.5 (F) and 5 (G); and the effect of X2X6 on zeta potential, at 55°C and pH 5 (H).
Notes: X1, phospholipid concentration (mM); X2, curcumin concentration (mM); X3, doxorubicin concentration (mM); X6, phospholipid:cholesterol molar ratio.
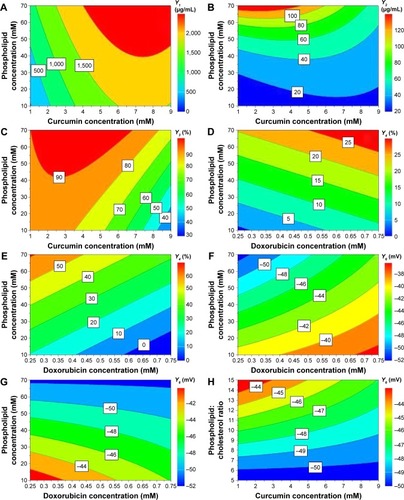
Figure 4 Design space for the formulation of CUR-DOX-LCL, represented as a function of CUR concentration and phospholipid concentration.
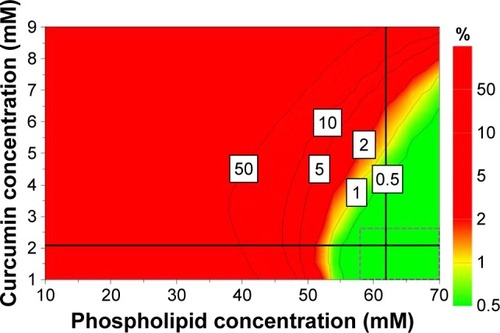
Table 5 Design space hypercube limits for independent variables, at 55°C and pH 5 of phosphate buffer
Table 6 Experimental and predicted results for the formulation within the design space and the formulation outside the design space
Figure 5 In vitro release profile of CUR and DOX from liposomes.
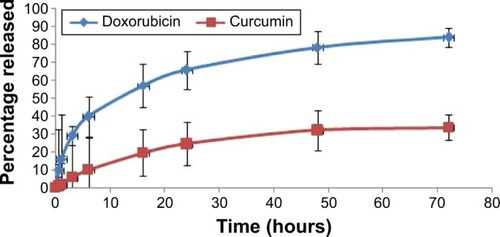
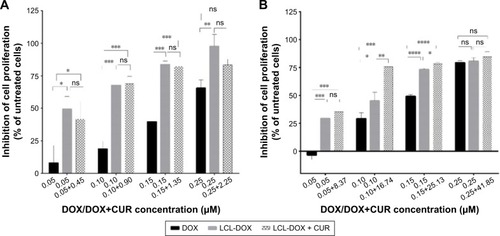
Figure 6 Effects of CUR-DOX-LCL on the proliferation of C26 murine colon carcinoma cells.
Abbreviations: CUR, curcumin; DOX, doxorubicin; LCL, long-circulating liposomes; ns, not significant.