Figures & data
Figure 1 (A) A schematic representation of the α- and β-subunits of a complete VGSC model. The figure depicts all the four domains (I–IV), with each domain including a VSD and a PD. The positively charged S4 helical segments of the VSDs, which connect with the respective PD, are shown as green helices and the location of inactivation gate is also marked. The 3D structure of the homology model of hNav1.5 ion channel is shown as (B) side-view and (C) top-view representations. The locations of the SFs residues are given in (D) and colored green (outer SF, EEDD) and violet (inner SF, DEKA). A trapped sodium ion is shown as a yellow van derWaals sphere. The four domains, DI, DII, DIII, and DIV, are shown in yellow, blue, silver, and red, respectively.
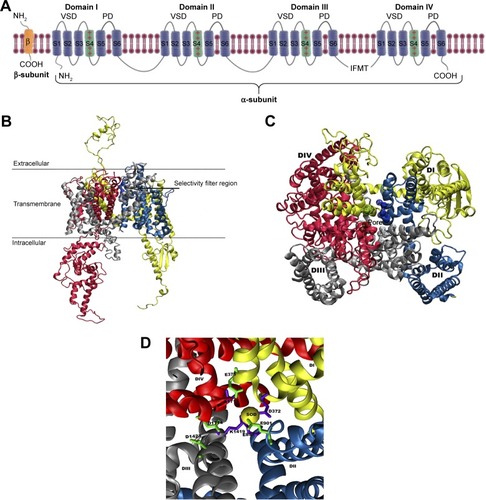
Table 1 Complete list of all molecules tested to validate the Nav1.5 model with the corresponding CHEMBL IDs, IC50, pIC50, and the AMBER-MMGBSA binding energy values
Figure 2 A top view of the outer channel’s vestibule showing a predominantly negative electrostatic potential that seems to be extremely efficient as a cation ion trap. This is the first layer of selectivity for cations, and then close to the selectivity filters, other mechanisms will be involved to trap the cation of choice, sodium.
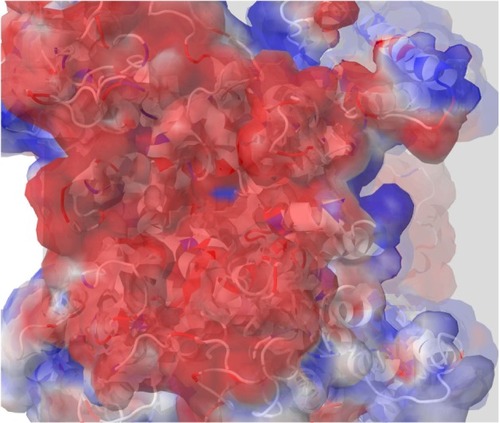
Figure 3 Two potential binding sites for sodium ions (S1 and S2) close to the outer selectivity filter. In S1, sodium (shown as a yellow van derWaals sphere) is coordinated by three carboxylates from E375, E901, and D1714, whereas it is only mono-coordinated by the D1423 carboxylate in S2. Our ion-solvation energy calculations, however, showed that S2 might be a more favorable site as S1 can experience a repulsive force from the gatekeeper, K1419.
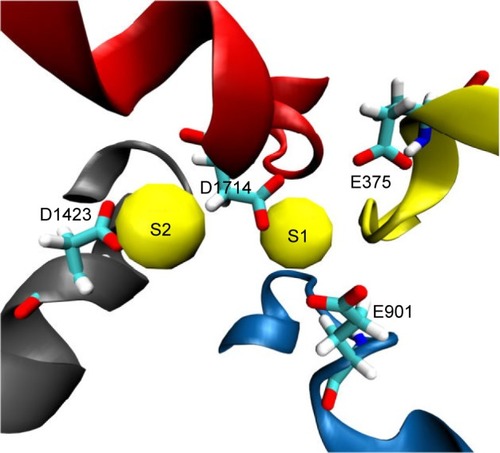
Figure 4 This figure depicts the role and conformational changes necessary for K1419 to allow sodium permeation. Figure (A) and (B) give a top and side view for K1419 in a representative “off-state” where K1419 is coordinated to E898 and S1710 blocking the ion permeation pathway. Figure (C) and (D) depicts K1419 in an “on-state” allowing sodium permeation through the pore. (D) SOD1 and SOD2 seems to facilitate the permeation of SOD3 which reaches the central cavity afterwards giving raise to SOD3” (violet). Upon the release of SOD3 to the central cavity, K1419 readopts an “off-state”, blocking the permeation of more sodium ions and preventing SOD3 from traveling in the reverse direction.
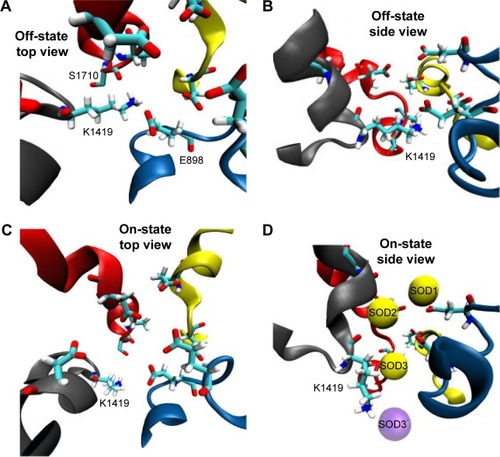
Figure 5 The electrostatic Poisson–Boltzmann solvation energy profile of one sodium ion pushed through the two SFs. The calculation adopts a 1D rigid potential scan where sodium is allowed to be pushed slowly toward the central cavity of the channel in consecutive steps of 0.2 Å each in the Z-direction. Protein conformation is fixed and the selected conformation was chosen such that the sodium ion experiences minimal steric clashes. (A) The 2D plot of the scan where a deep minima appears to exist at the region between the two SFs, close to S1710, and two maxima appears to exist close to R376 and K1419. (B) The locations of these residues relative to the sodium direction are represented as closely overlapping vdW spheres.
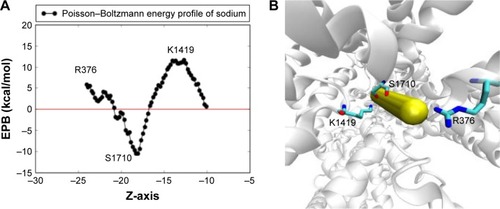
Figure 6 The hydration of sodium ion at the outer SF (A) and the central cavity (B). As we can see in (A), water molecules allow sodium to slide through the filter by satisfying the H-bods of the negatively charged SF residues, which are E375, E901, D1423, and D1714. In (B), inner and outer SF residues shown as green and violet batches, respectively, over the cartoon representation of the hNav1.5 protein.
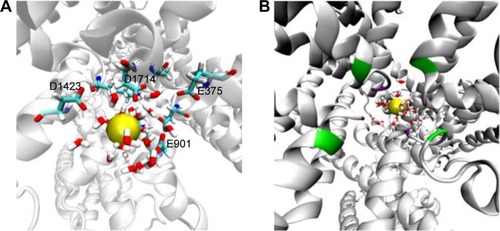
Figure 7 The pulling of hNa+ ion out of the central cavity of the hNav1.5 model in the final snapshot (or snap1) through pathway 1. The 3D representation (A) describes that the hNa+ ion (shown as a yellow vdW sphere) was trapped near the DEKA motif at the central cavity of the ion channel exiting through the S6 helices (shown as blue ribbons) of the domains DII and DIII (pathway 1). The ion, under the influence of external force, passes through a number of hydrophobic residues (shown as sticks and listed in the figure) and is finally released by the conformational changes of F934 (within the circle) and the disruption of H-bonds between N1463 and L938 residues (shown as broken lines in black). The positions of the ion surrounded by water molecules at different timescales (3, 42, 63, and 78 ps) during the SMD simulation are shown as vdW spheres in yellow and the positions of the ions along each step until the release are shown as smaller CPK spheres in red. The corresponding force profile for the pulling of the ion and the numbers of water molecules surrounding the ions throughout this trajectory are shown (B), respectively, of the image on the right.
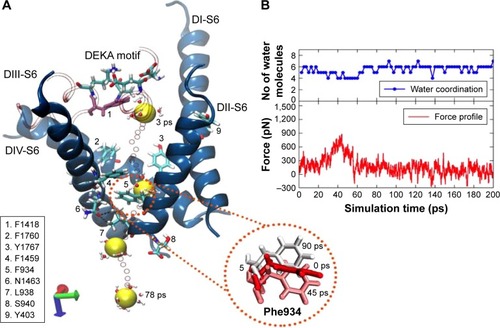
Figure 8 The pulling of the hNa+ ion out of the central cavity of the hNav1.5 model in the snap6 through pathway 2. (A) The 3D representation on the left describes that the hNa+ ion (shown as a yellow vdW sphere) trapped near the DEKA motif at the central cavity of the ion channel exits through the S6 helices (shown as blue ribbons) of the domains DIII and DIV. The ion, under the influence of external force, passes through a number of hydrophobic residues (shown as sticks and listed in the figure) and is finally released by disruption of H-bonds between V1337 and C1341 residues (shown within rectangular box) and later via the short S4/S5 helix of DII. The positions of the ion surrounded by water molecules at different timescales (3, 40, 60, and 78 ps) during the SMD simulation are shown as vdW spheres in yellow, and the positions of the ions along each step until the exit are shown as smaller CPK spheres in red. (B) The corresponding force profile for the pulling of the ion and the numbers of water molecules surrounding the ions throughout this trajectory are shown in the bottom and top panels, respectively, of the image (C).
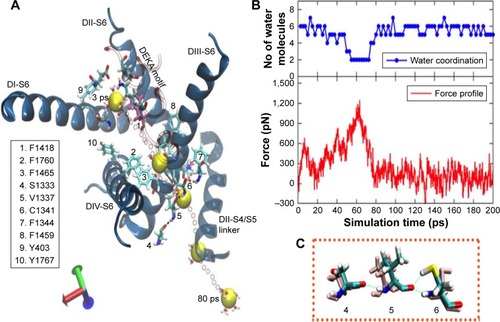
Figure 9 The pulling of the hNa+ ion out of the central cavity of the hNav1.5 model in the snap5 of the classical MD simulation. The 3D representations describe that the hNa+ ion (shown as a yellow vdW sphere) trapped at the central cavity of the ion channel in snap5 exits either through pathway 1 (within S6 helices of DII and DIII, [A]) or through pathway 2 (within S6 helices of DIII and DIV, [B]). Positions of the ion surrounded by water molecules at different timescales during the SMD simulation are shown as vdW spheres in yellow, and the positions of the ions along each step until the release from S6 helices are shown as smaller CPK spheres in red.
![Figure 9 The pulling of the hNa+ ion out of the central cavity of the hNav1.5 model in the snap5 of the classical MD simulation. The 3D representations describe that the hNa+ ion (shown as a yellow vdW sphere) trapped at the central cavity of the ion channel in snap5 exits either through pathway 1 (within S6 helices of DII and DIII, [A]) or through pathway 2 (within S6 helices of DIII and DIV, [B]). Positions of the ion surrounded by water molecules at different timescales during the SMD simulation are shown as vdW spheres in yellow, and the positions of the ions along each step until the release from S6 helices are shown as smaller CPK spheres in red.](/cms/asset/37741226-788c-4d2b-b33a-0a701cc344be/dddt_a_133944_f0009_c.jpg)
Figure 10 The RMSD clustering for binding-site residues of the hNav1.5 model over the 580 MD production simulations. (A) The DBI over the SSR/SST metrices plot is shown, in which the clustering converges at 20 dominant PDB conformations; (B) the superimposed structures of the 20 dominant PDB conformations, selected through the RMSD clustering of binding-site residues of the hNav1.5 MD trajectory, are also provided.
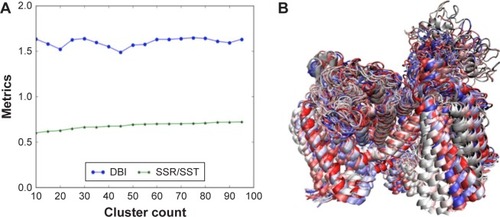
Figure 11 A 2D scatter plot comparing the calculated AMBER-MMGBSA binding free energies against the in vitro measured pIC50 data from CHEMBL. Data points were fitted using gnuplot according to the model: f(x) = ax + b; where a is given by −2.12 and b is given by −20.74. The point represents flecainide (weakest blocker); lidocaine and the strong blockers regions are circled.
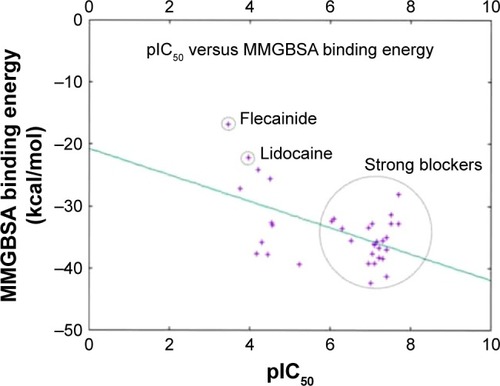
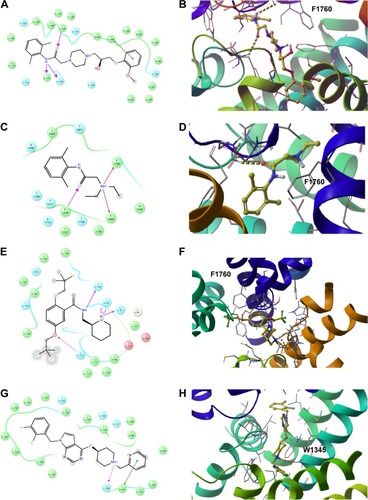
Figure 12 The 2D (left panel) and 3D (right panel; top view) ligand interactions for selected four hNav1.5 blockers under study. (A, B) Ranolazine, (C, D) lidocaine (E, F), flecainide, and (G, H) CHEMBL2012299. In contrast to ranolazine, lidocaine, and flecainide that bind to the center of the channel close to Phe1760, the binding mode of CHEMBL2012299 shows that it is shifted to the fenestration sites of the hNav1.5 protein.