Figures & data
Table 1 Inhibitory effects of amide derivatives 4a–e and 6a–e on mushroom tyrosinase and porcine pancreas elastase
Table 2 Inhibitory effects of amide derivatives 4a–e and 6a–e on human tyrosinase (from melanoma cells) free radical scavenging
Table 3 Kinetic parameters of mushroom tyrosinase for L-DOPA activity in the presence of different concentration of compounds 4c, 6a, 6b and 6d
Figure 1 Lineweaver–Burk plots for inhibition of tyrosinase in the presence of amide 4c.
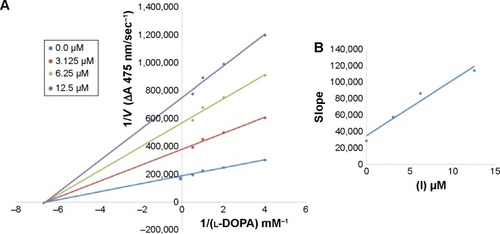
Figure 2 Lineweaver–Burk plots for inhibition of tyrosinase in the presence of amide 6a.
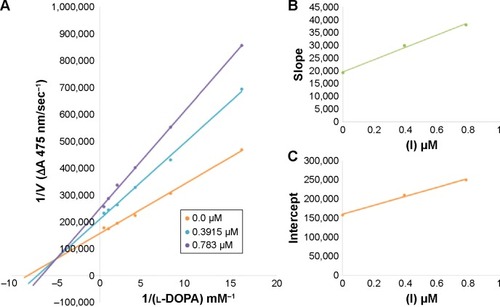
Figure 3 Lineweaver–Burk plots for inhibition of tyrosinase in the presence of amide 6b.
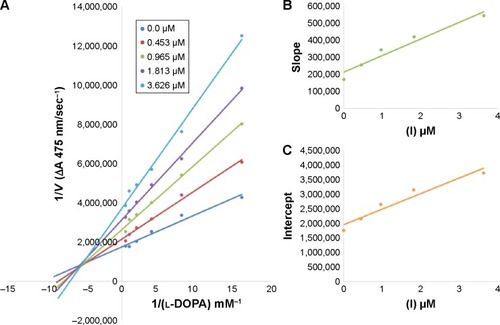
Figure 4 Lineweaver–Burk plots for inhibition of tyrosinase in the presence of amide 6d.
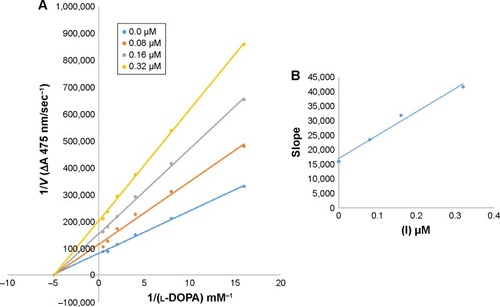
Figure 5 Effect of various doses of mushroom tyrosinase on its activity for the catalysis of l-DOPA against different concentration of inhibitor 6d.
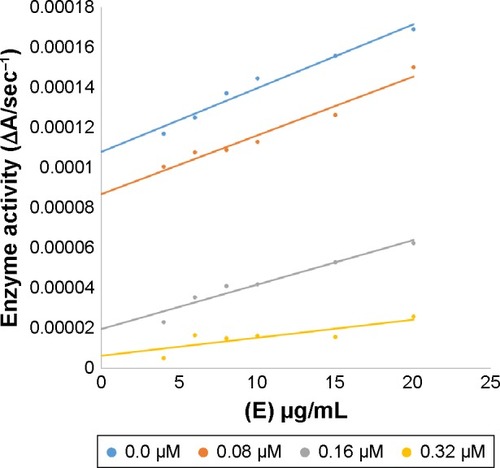
Figure 6 Effect of inhibitor 6d on pigmentation of zebrafish.
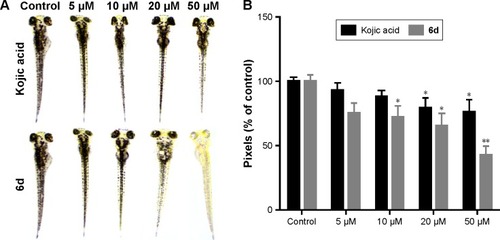
Figure 7 Inhibitory effects of 6d and kojic acid on melanin contents.
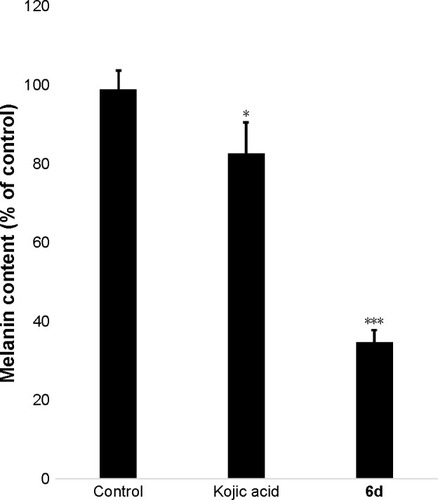
Figure 8 Zebrafish embryos (48 hpf) were treated with 10, 20 and 50 µM of 6d.
Abbreviation: hpf, hours post-fertilization.
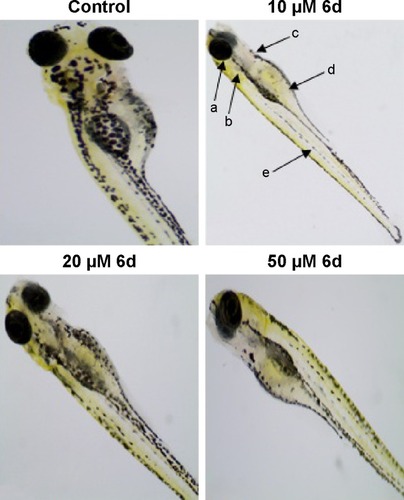
Table 4 Chemo-informatics evaluation of the synthesized compounds
Figure 9 Docking energies of the synthesized amide derivatives 4a–e and 6a–e calculated using PyRx.
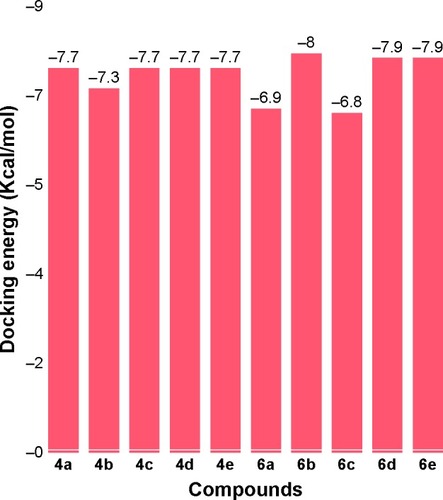
Figure 10 Docking interactions between 6d and target protein.
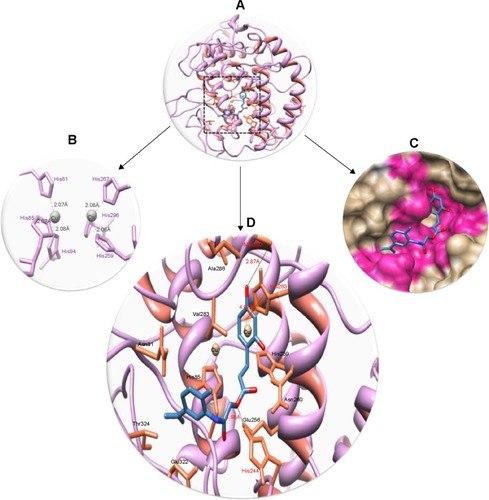
Figure 11 RMSD graph of 6a and 6d at 15 ns.
Abbreviation: RMSD, root mean square deviation.
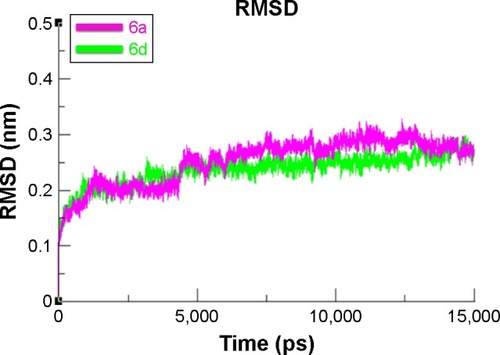
Figure 12 RMSF graph of 6a and 6d at 15 ns.
Abbreviation: RMSF, root mean square fluctuation.
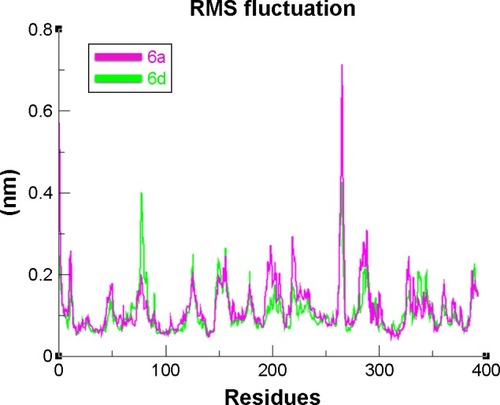
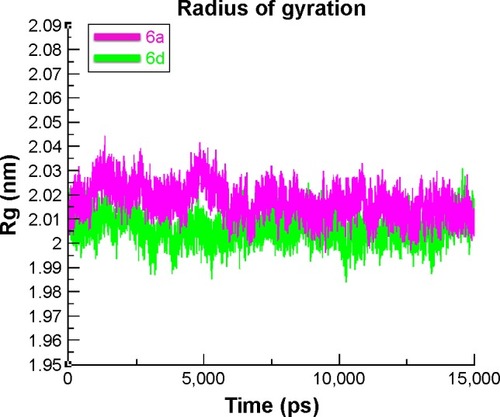
Figure 13 Radius of gyration (Rg) graphs of 6a and 6d: bound and unbound formats.
Scheme 1 Synthesis of amide derivatives (4a–e).
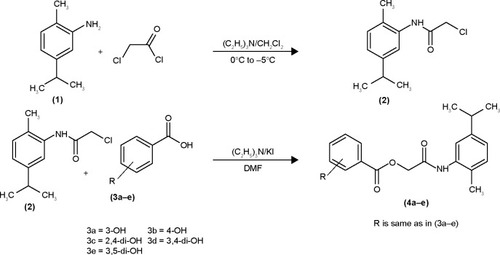
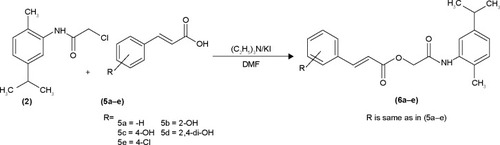
Scheme 2 Synthesis of amide derivatives (6a–e).