Figures & data
Figure 1 B01002 and C26001 inhibited SKOV3 cell proliferation and promoted apoptosis in vitro. SKOV3 cells were treated with B01002 and C26001 for 24 h. (A) Cell viability inhibition curve of B01002 and C26001 by CCK-8 assay. (B) Representative images of Hoechst staining of cells treated by B01002 and C26001. Arrows: apoptotic nuclear changes. Scale bar: 100 µm. (C) Apoptosis of cells treated by different concentrations of B01002 and C26001 evaluated by flow cytometry analysis using V-FITC and PI staining.
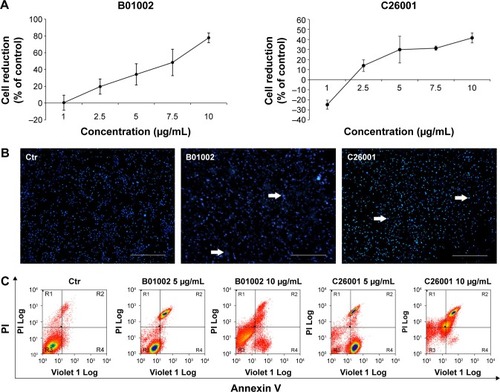
Figure 2 B01002 and C26001 inhibited tumor growth on SKOV3 xenograft mouse model. (A) Tumor growth curves of different treatment groups of PBS, DDP, B01002, and C26001. (B) Mean tumor growth inhibition (TGI) was calculated at the end of the treatment. (C) Pictures of resected tumors of four groups. **P<0.05.
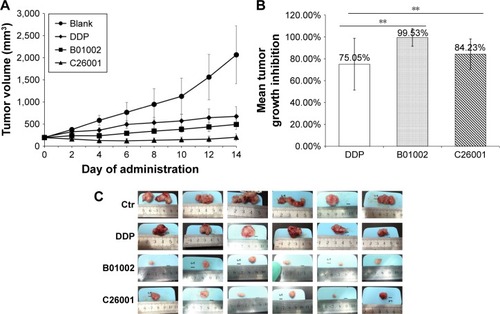
Figure 3 B01002 and C26001 inhibited tumor proliferation in vivo. (A) Left, representative Ki-67 staining images of tumors resected from tumor-bearing mice treated with B01002, C26001, DDP, or PBS, magnification ×100; Right, the ratio of positive Ki-67 nuclear staining to total number of nuclei was measured for each field, and the cumulative results are summarized as bar graphs. (B) Changes in PCNA expression of xenografted tumors following 14-day treatment. (C) mRNA levels of PCNA in different groups determined by qRT-PCR. *P>0.05; **P<0.05.
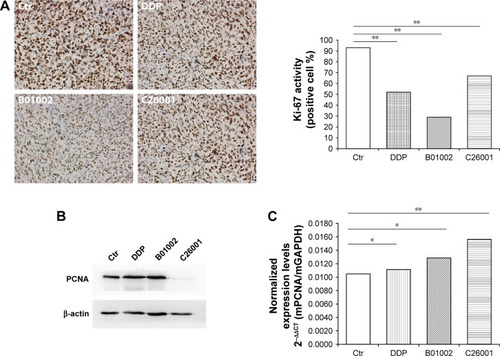
Figure 4 B01002 and C26001 induced apoptosis in vivo. TUNEL detection of apoptotic cells of tumors resected from tumor-bearing mice from different groups (red). Nuclei are stained with DAPI (blue). Top, representative image of DAPI and TUNEL staining. Arrows, cells exhibiting typical apoptotic morphology. Magnification ×100. Bottom, percentages of TUNEL-positive cells determined by cell counting. **P<0.05.
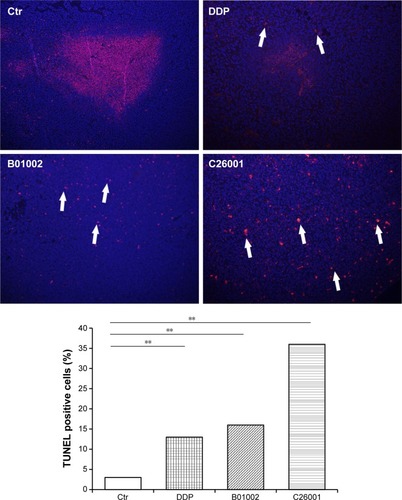
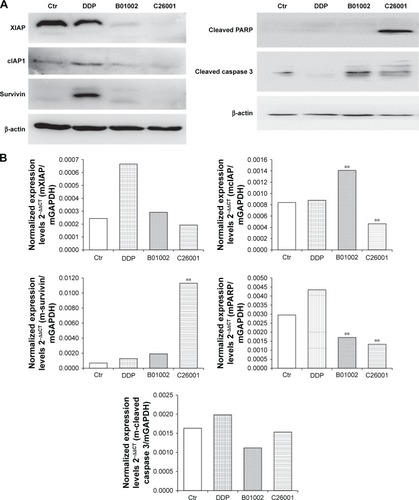
Figure 5 B01002 and C26001 inhibited inhibitor of apoptosis proteins (IAP). (A) Western blot of IAPs and apoptosis-related proteins; β-actin was used as loading control. (B) mRNA levels of IAP and apoptosis-related proteins by qRT-PCR. **P<0.05 compared with the control group.
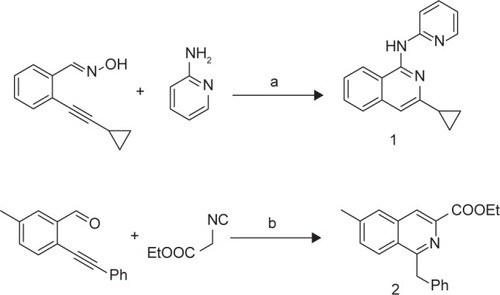
Scheme 1 Syntheses of isoquinoline 1 and 2.