Figures & data
Figure 1 Scanning electron microscope image of the different microspheres.
Notes: Scanning electron microscopic image of unloaded microspheres (A) with a magnification of 700× and rifampicin-loaded microspheres (B) with a magnification of 700×.
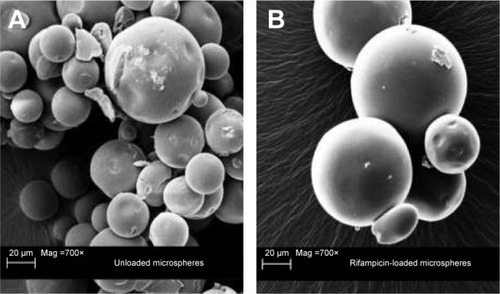
Figure 2 Measurement of the particle size distribution of the different manufactured microspheres.
Notes: Particle size distribution of unloaded microspheres (A; n=3 batches) and rifampicin-loaded microspheres (B; n=3 batches) measured via a Mastersizer 2000. The unloaded microspheres have a median diameter of 64.43±3.61 μm and rifampicin-loaded microspheres have a median diameter of 67.93±3.39 μm.
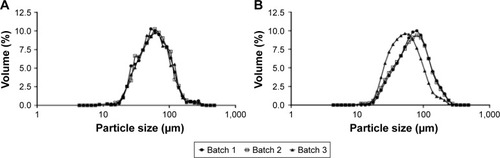
Figure 3 Investigation of the in vitro drug release from rifampicin-loaded microspheres.
Notes: In vitro kinetic drug release study from rifampicin-loaded microspheres incubated in PBS at 37°C over 60 days (n=3). Data are given as mean with standard error of mean.
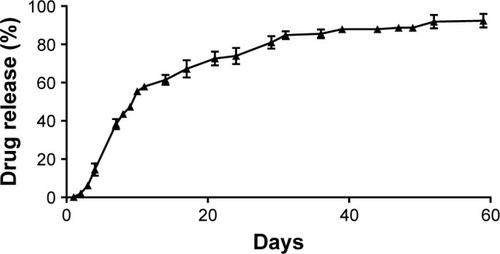
Figure 4 Agar diffusion test with unloaded and rifampicin-loaded microspheres.
Notes: Investigation of the antibacterial effect of rifampicin-loaded microsphere (Aii) in comparison with the unloaded microsphere (Ai). The inhibition zone around the rifampicin-loaded microsphere amounts to 14 mm. Agar diffusion test with rifampicin-loaded microspheres–coated mesh implant discs (B), performed to investigate the antibacterial efficiency over 30 days. The inhibition zones vary between 15 mm after one day and 1 mm after 30 days.
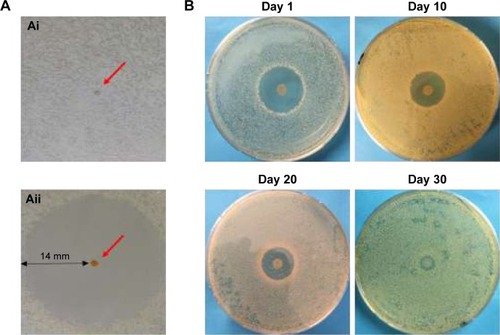
Figure 5 MTT assay of unloaded and rifampicin-loaded microspheres (n=3).
Notes: MTT assay was performed with BJ fibroblast after 24 hours of incubation at 37°C with 0.5 mg, 0.75 mg, 1 mg, 1.5 mg, and 2.0 mg rifampicin-loaded microspheres and unloaded microspheres per mL cell medium to investigate the cytotoxicity. The experiment was performed in triplicates. Data are shown as scatter plot with SEM.
Abbreviation: SEM, scanning electron microscopy.
Abbreviation: SEM, scanning electron microscopy.
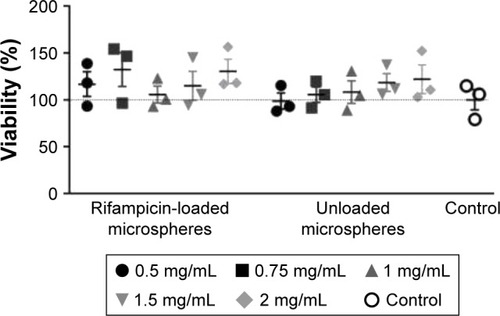
Figure 6 Scanning electron microscopy micrographs of different explanted mesh implants.
Notes: A survey of an uncoated mesh implant (A), surface with adhered bacteria of an uncoated mesh implant (B), and an unloaded microsphere coated mesh implant (C and D). No bacteria adhere on the surface of the rifampicin-loaded microsphere coated mesh implant (E and F).
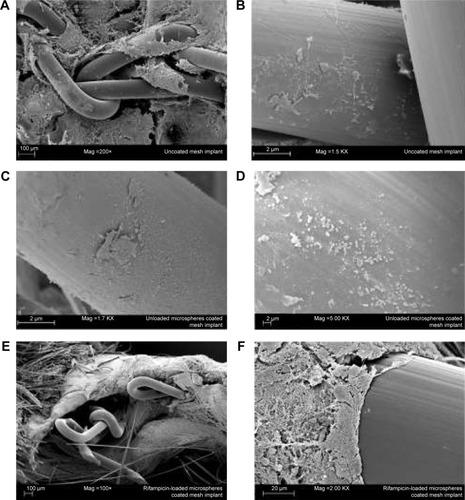
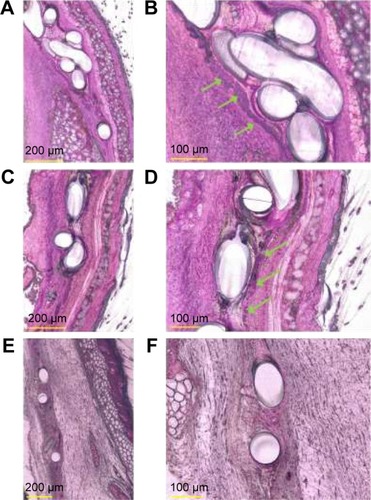
Figure 7 Histological evaluation of Technovit® 7200 imbedded, explanted mesh implants.
Notes: The explanted mesh implants showed cluster of bacteria on uncoated (A, magnification 400×) and unloaded PLGA microspheres–coated (C, magnification 400×) mesh implants. Detailed histology shows (B, magnification 1,000×): the presence of bacteria (green arrow) on an uncoated mesh implant; (D, magnification 600×): bacteria growth on the surface of an unloaded PLGA microspheres–coated mesh implant. Bacteria were found in clusters. The rifampicin-coated mesh implants (E, magnification 300×; F, magnification 600×) investigation resulted in no bacteria being found on the implant surface or the surrounding tissue.