Figures & data
Figure 1 Flowchart showing the selection of the treatment cohort.
Abbreviations: LT, liver transplantation; HCV, hepatitis C virus; DAA, direct-acting antiviral; SVR, sustained virological response; IFN, interferon.
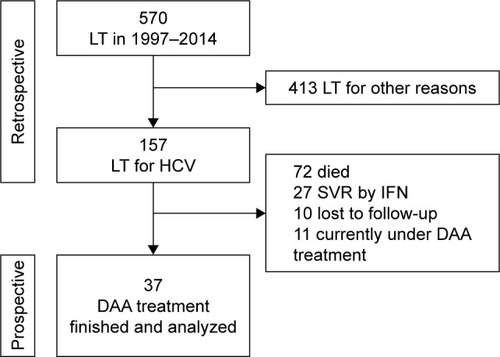
Figure 2 Survival of patients after liver transplantation with or without HCV (A) and GT1 vs non-GT1 (B).
Abbreviations: HCV, hepatitis C virus; OLT, orthotopic liver transplantation; GT, genotype.
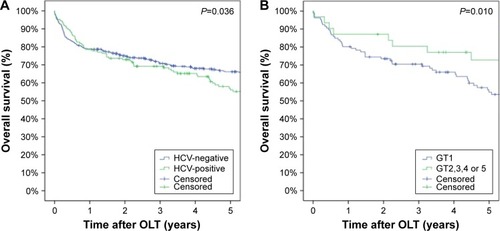
Table 1 Patient demographics at baseline (quantitative data are given as medians and interquartile range in parentheses)
Figure 3 Therapeutic regimens sorted by treatment duration.
Abbreviations: SOF, sofosbuvir; LDV, ledipasvir; RBV, ribavirin; SMV, simeprevir; DAA, direct-acting antiviral; DCV, daclatasvir; IFN, interferon; 3D, paritaprevir/ritonavir with ombitasvir and dasabuvir.
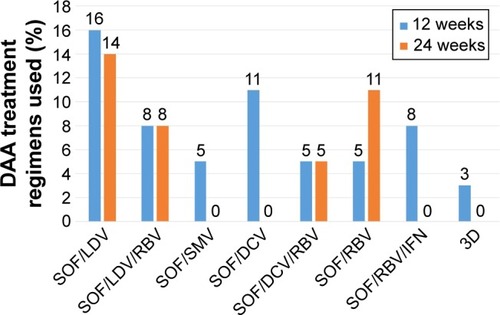
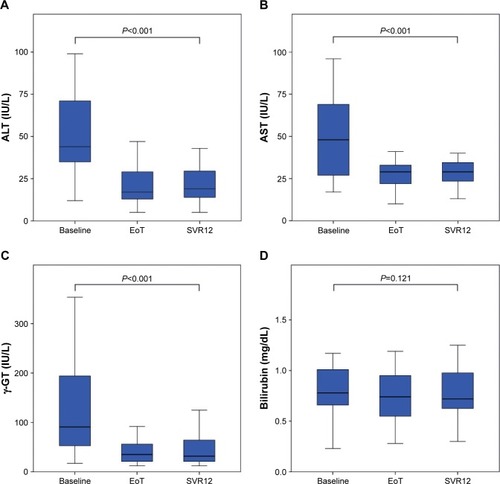
Figure 4 Biochemical response to DAA therapy. The activities of ALT (A), AST (B), γ-GT (C), and the serum levels of total bilirubin (D) declined within the observation period.
Abbreviations: ALT, alanine aminotransferase; AST, aspartate aminotransferase; DAA, direct-acting antiviral; γ-GT, gamma-glutamyl transferase; EoT, end of treatment; SVR12, sustained virological response 12 weeks after EoT.