
Figures & data
Table 1 Demographic and baseline characteristics
Table 2 Summary of verinurad plasma PK following single ascending doses in fasted and fed states
Figure 1 Mean (SE) verinurad plasma concentration–time profiles following single ascending doses in fasted and fed states (A) and following multiple daily ascending doses in the fasted state (B).
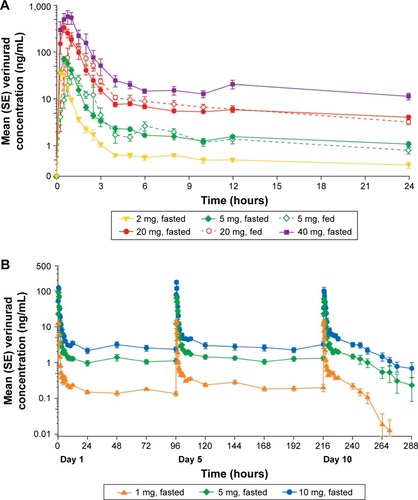
Table 3 Summary of verinurad plasma PK and urinary fractional excretion of verinurad following the first and tenth doses in the fasted state
Figure 2 Dose proportionality of verinurad Cmax and AUC0-∞.
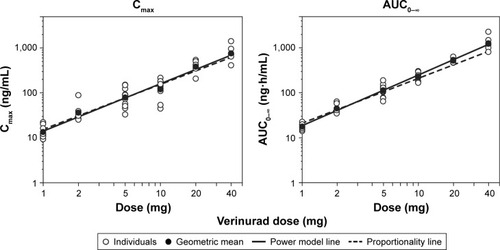
Figure 3 Mean (SE) percent change from baseline in sUA–time profiles following single dose in the fasted or fed state (A) and once-daily multiple (B) doses of verinurad in the fasted state.
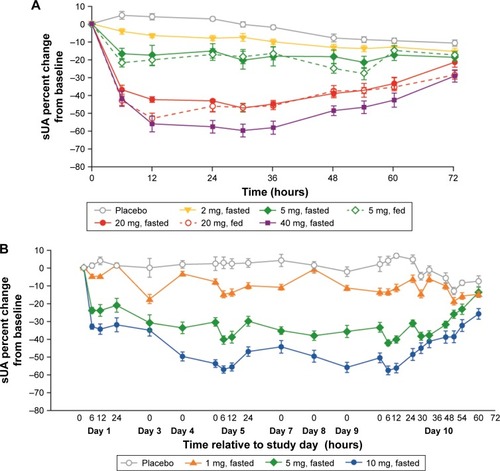
Figure 4 Mean (SE) AeUR (A and B) and FEUA (C and D) by urine collection interval following single ascending doses (A and C) or once-daily multiple ascending doses (B and D) of verinurad.
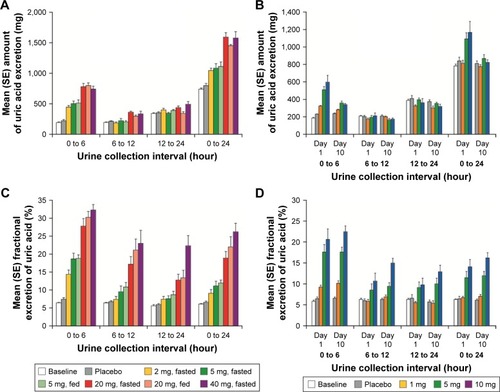
Table 4 Summary of treatment-emergent AEs following single or multiple ascending doses of verinurad