Figures & data
Figure 1 Scheme graph and TEM images of HA-CH-IRN/5-FU NPs and other NPs.
Notes: (A) Scheme graph of the structure of HA–CH–IRN/5-FU NPs. (B) TEM image of HA–CH–IRN/5-FU NPs. (C) TEM images of HA–CH–IRN/5-FU NPs (1), CH–IRN/5-FU NPs (2), IRN NPs (3), 5-FU NPs (4) and HA–CH NPs (5) (yellow scale bars represent 200 nm).
Abbreviations: HA, hyaluronic acid; CH, chitosan; IRN, irinotecan; 5-FU, 5-fluorouracil; NP, nanoparticle; PLGA, poly(d,l-lactide-co-glycolide); TEM, transmission electron microscopy.
Abbreviations: HA, hyaluronic acid; CH, chitosan; IRN, irinotecan; 5-FU, 5-fluorouracil; NP, nanoparticle; PLGA, poly(d,l-lactide-co-glycolide); TEM, transmission electron microscopy.
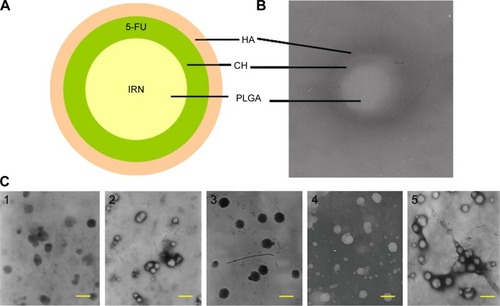
Table 1 Characterization of NPs
Figure 2 Changes in size in the presence of serum.
Note: Data are presented as mean ± SD (n=3).
Abbreviations: HA, hyaluronic acid; CH, chitosan; IRN, irinotecan; 5-FU, 5-fluorouracil; NPs, nanoparticles.
Abbreviations: HA, hyaluronic acid; CH, chitosan; IRN, irinotecan; 5-FU, 5-fluorouracil; NPs, nanoparticles.
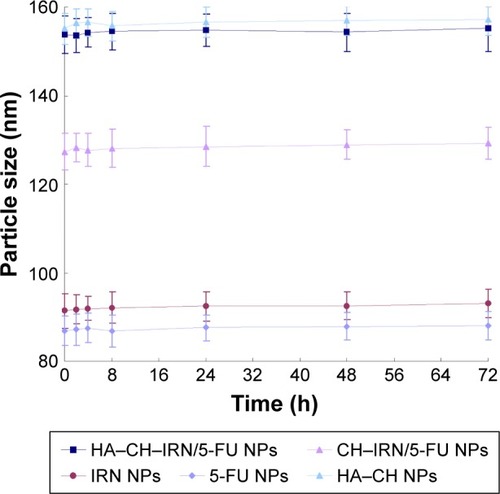
Figure 3 In vitro release of IRN (A) and 5-FU (B) from NPs.
Note: Data are presented as mean ± SD (n=3).
Abbreviations: IRN, irinotecan; 5-FU, 5-fluorouracil; NPs, nanoparticles; HA, hyaluronic acid; CH, chitosan.
Abbreviations: IRN, irinotecan; 5-FU, 5-fluorouracil; NPs, nanoparticles; HA, hyaluronic acid; CH, chitosan.
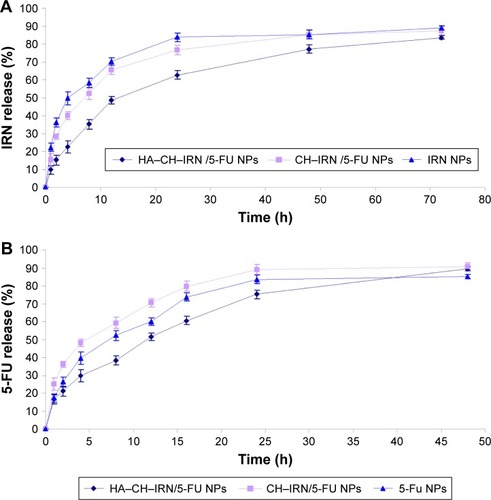
Figure 4 Cellular uptake efficiency of the NPs.
Note: Data are presented as mean ± SD (n=3).
Abbreviations: NPs, nanoparticles; HA, hyaluronic acid; CH, chitosan; IRN, irinotecan; 5-FU, 5-fluorouracil.
Abbreviations: NPs, nanoparticles; HA, hyaluronic acid; CH, chitosan; IRN, irinotecan; 5-FU, 5-fluorouracil.
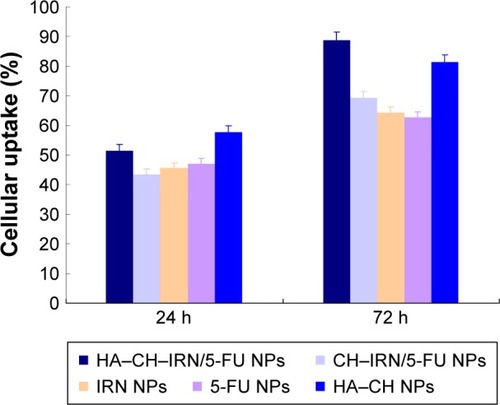
Figure 5 In vitro cytotoxicity of IRN and/or 5-FU-contained solutions or NPs investigated in MGC803 cells.
Note: Data are presented as mean ± SD (n=3).
Abbreviations: IRN, irinotecan; 5-FU, 5-fluorouracil; NPs, nanoparticles; HA, hyaluronic acid; CH, chitosan.
Abbreviations: IRN, irinotecan; 5-FU, 5-fluorouracil; NPs, nanoparticles; HA, hyaluronic acid; CH, chitosan.
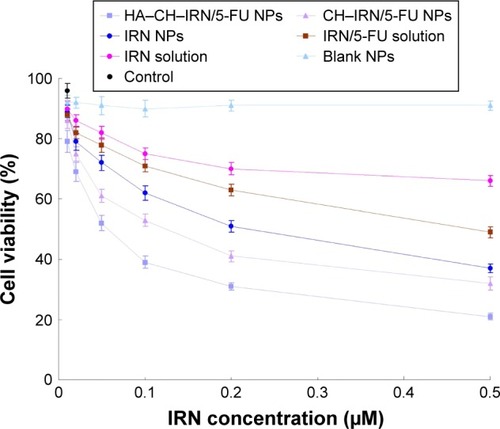
Table 2 Synergistic effect evaluation and selection of the ratio of drugs by CI calculation
Figure 6 In vivo tissue distribution of IRN (A) and 5-FU (B) investigated in GC-bearing mice model.
Note: Data are presented as mean ± SD (n=8).
Abbreviations: IRN, irinotecan; 5-FU, 5-fluorouracil; GC, gastric cancer; HA, hyaluronic acid; CH, chitosan; NPs, nanoparticles.
Abbreviations: IRN, irinotecan; 5-FU, 5-fluorouracil; GC, gastric cancer; HA, hyaluronic acid; CH, chitosan; NPs, nanoparticles.
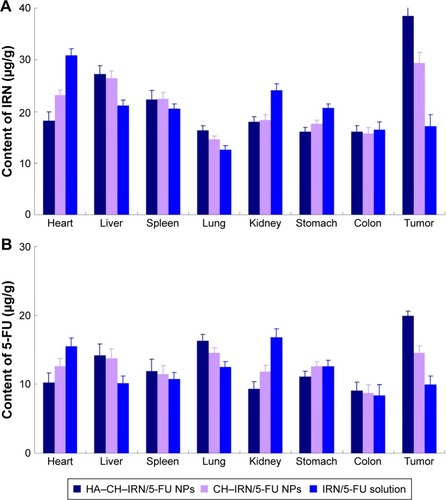
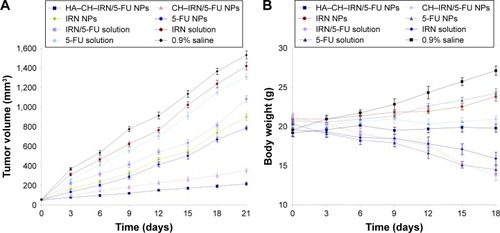
Figure 7 In vivo antitumor effect and system toxicity of the NPs evaluated in terms of tumor volume (A) and body weight changes (B). Note: Data are presented as mean ± SD (n=8).
Abbreviations: NPs, nanoparticles; HA, hyaluronic acid; CH, chitosan; IRN, irinotecan; 5-FU, 5-fluorouracil.