
Figures & data
Table 1 Clinical and anthropometric characteristics of the patients diagnosed with OI at first hospital admission
Table 2 Clinical aspects of the study group
Figure 1 Newborn with triangle face.
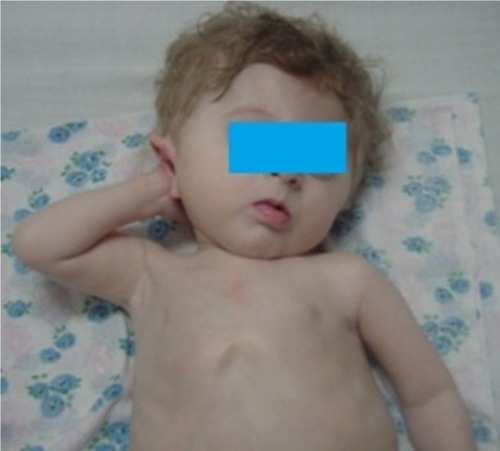
Figure 2 Short stature due to limb fractures with large head and barrel-shaped rib cage.
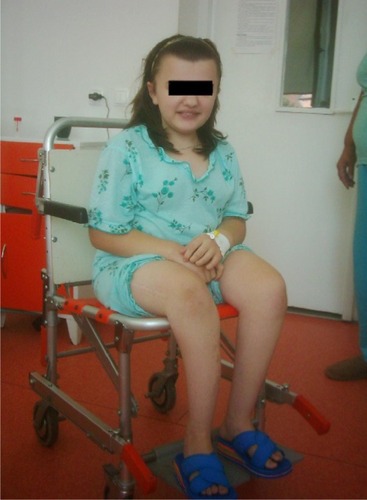
Figure 3 Dentinogenesis imperfecta with brown–yellow spots, malposition and friability.
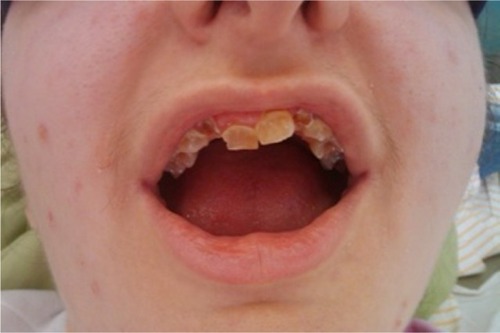
Figure 4 The evolution of Z-score in patients before and after 3 years of treatment with pamidronate.
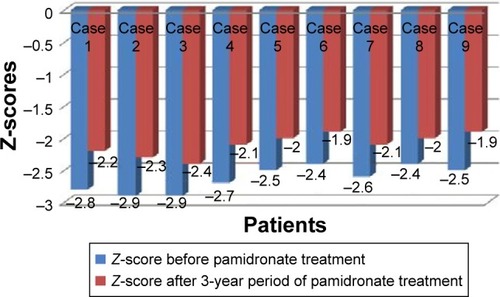
Figure 5 Scatter diagram of serum alkaline phosphatase values and the number of fractures in patients before treatment.
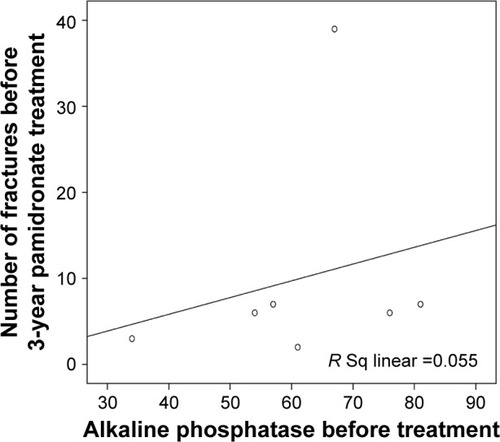
Figure 6 Scatter diagram between the serum alkaline phosphatase and number of fractures in patients after 3 years of treatment.
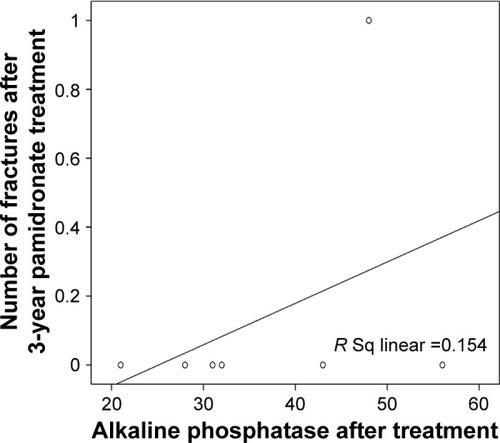
Figure 7 The evolution of serum bone alkaline phosphatase before and after 3-year period of treatment with pamidronate.
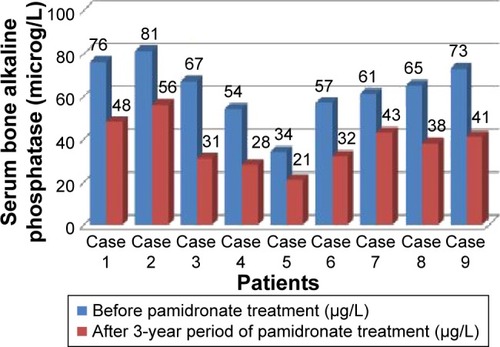
Table 3 The serum levels of osteocalcin and β-crosslaps (β–CTx) in these patients before and after pamidronate treatment