Figures & data
Figure 1 Schematic representation of the molecular structure of AOS prepared by enzymatic degradation.
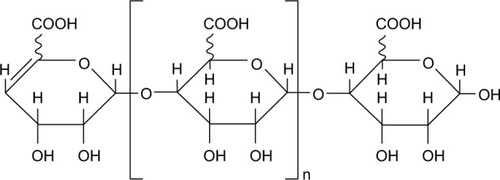
Figure 2 Effect of AOS pretreatment on myocardial infarct size 24 hours after I/R injury as measured by Evans blue-TTC double staining.
Abbreviations: AOS, alginate oligosaccharide; I/R, ischemia/reperfusion; TTC, triphenyltetrazolium chloride; AAR, area at risk; IS, infarct size; LV, left ventricle size.
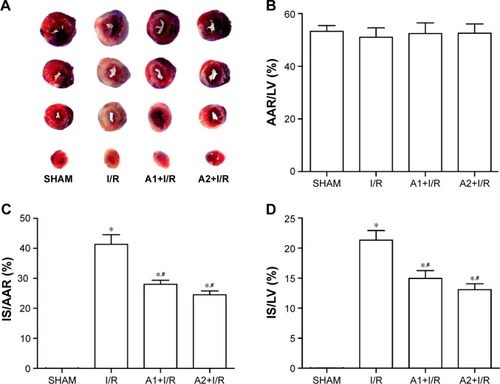
Figure 3 Effect of AOS pretreatment on cardiac function 24 hours after I/R injury.
Abbreviations: AOS, alginate oligosaccharide; I/R, ischemia/reperfusion; EF, left ventricular ejection fraction; FS, left ventricular fractional shortening; LVESP, left ventricular end-systolic pressure; LVEDP, left ventricular end-diastolic pressure; dp/dtmax, maximal slope of systolic pressure increment; dp/dtmin, maximal slope of diastolic pressure decrement.
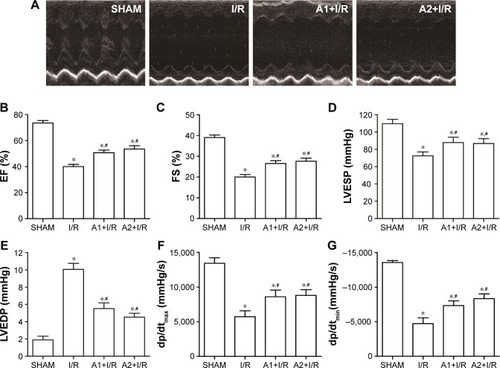
Figure 4 Effect of AOS pretreatment on plasma cTnI level 24 hours after I/R injury as measured by ELISA.
Abbreviations: AOS, alginate oligosaccharide; cTnI, concentration of cardiac troponin-I; I/R, ischemia/reperfusion.
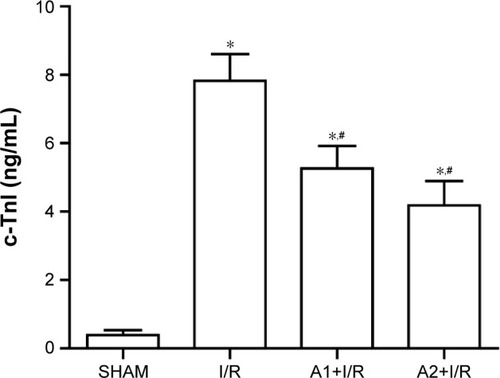
Figure 5 Effect of AOS pretreatment on myocardial apoptosis 3 hours after I/R injury as determined by TUNEL staining.
Abbreviations: AOS, alginate oligosaccharide; I/R, ischemia/reperfusion; TUNEL, terminal deoxynucleotidyl transferase-mediated dUTP nick end labeling.
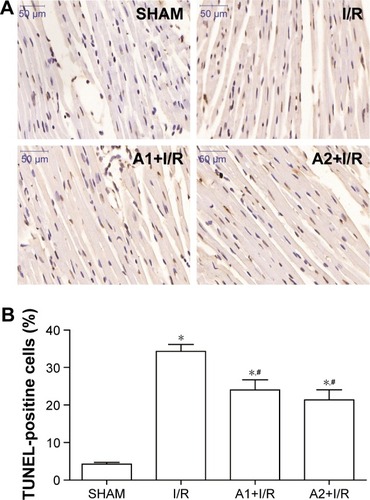
Figure 6 Effect of AOS pretreatment on the level of nitrative/oxidative stress 3 hours after I/R injury.
Abbreviations: AOS, alginate oligosaccharide; I/R, ischemia/reperfusion; iNOS, inducible nitric oxide synthase, NOX2, NADPH oxidase2; 4-HNE, 4-hydroxynonenal.
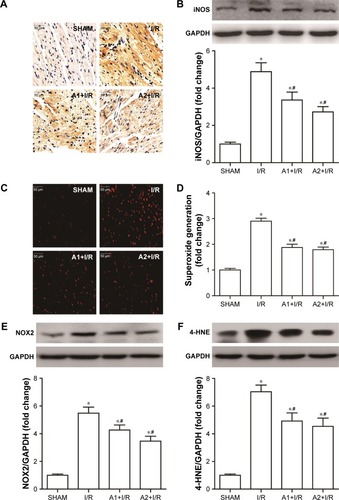
Figure 7 Effect of AOS pretreatment on the expression of Bax and Bcl-2 3 hours after I/R injury as detected by Western blot analysis.
Abbreviations: AOS, alginate oligosaccharide; Bax, Bcl-2-associated X protein; Bcl-2, B-cell lymphoma-2; I/R, ischemia/reperfusion.
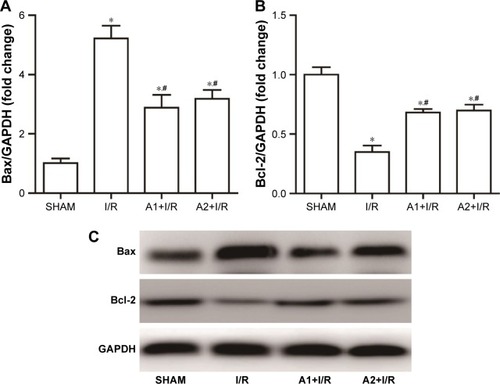
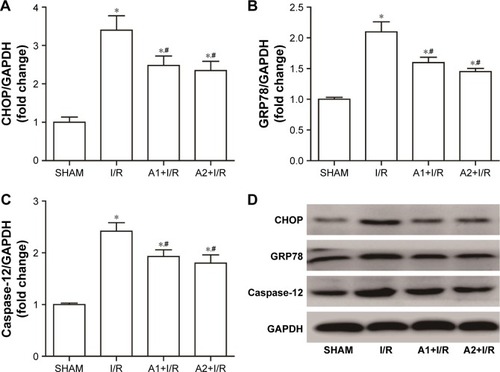
Figure 8 Effect of AOS pretreatment on the expression of ER stress-related proteins 3 hours after I/R injury detected by Western blot.
Abbreviations: AOS, alginate oligosaccharide; ER, endoplasmic reticulum; I/R, ischemia/reperfusion; CHOP, C/EBP homologous protein; GRP78, glucose-regulated protein 78.