Figures & data
Figure 1 The chemical structure of 10H-3,6-diazaphenothiazine. ©2016 Informa UK Limited, trading as Taylor & Francis Group. Reproduced from Morak-Młodawska B, Pluta K, Latocha M, Suwińka K, Jeleń M, Kuśmierz D. 3,6-Diazaphenothiazines as potential lead molecules – synthesis, characterization and anticancer activity. J Enzyme Inhib Med Chem. 2016;31:1512–1519.Citation20
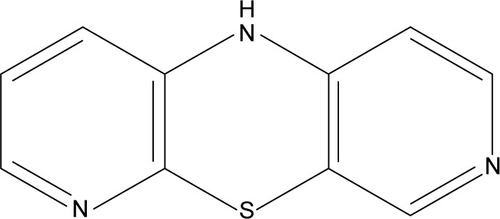
Figure 2 The trial compound PTZ induced concentration-dependent inhibitory effects toward A2780 ovarian cancer cells after incubated for 24 hours.
Abbreviation: PTZ, 10H-3,6-diazaphenothiazine.
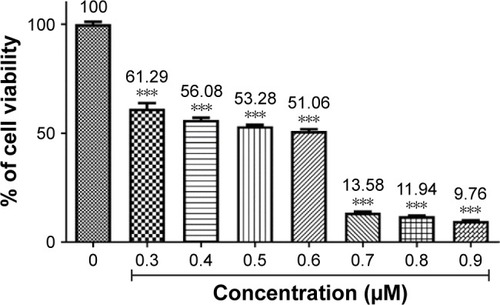
Figure 3 Cell cytotoxicity activity of PTZ toward representative normal cell lines.
Abbreviation: PTZ, 10H-3,6-diazaphenothiazine.
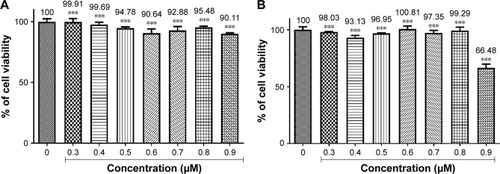
Figure 4 Images of AO/PI staining of A2780 cells.
Abbreviations: AO, Acridine orange; PI, propidium iodide; PTZ, 10H-3,6-diazaphenothiazine.
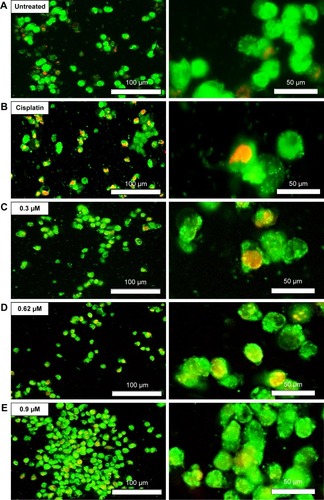
Figure 5 Images of DAPI staining of A2780 ovarian cancer cells.
Abbreviations: PTZ, 10H-3,6-diazaphenothiazine; DAPI, 4′,6-diamidine-2′-phenylindole.
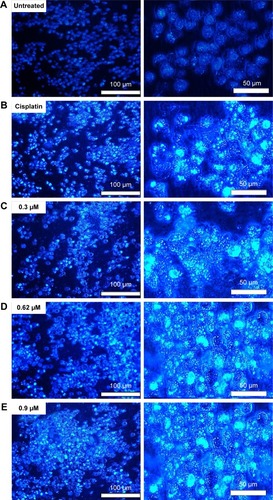
Figure 6 (A) Untreated, (B) cisplatin-treated, (C) PTZ at 0.3 µM, (D) IC50 of PTZ at 0.62 µM, and (E) PTZ at 0.9 µM. The quadrant graph of quantitative assay of apoptosis induced by PTZ toward A2780 cancer cells.
Abbreviations: FITC, fluorescein isothiocyanate; PTZ, 10H-3,6-diazaphenothiazine.
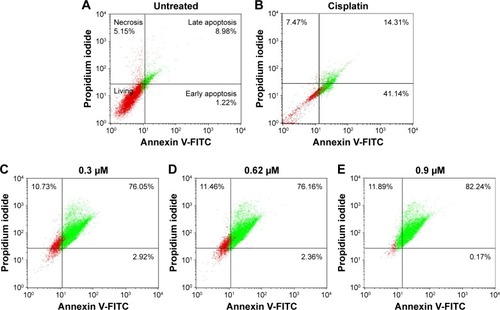
Figure 7 Application of PTZ toward A2780 cancer cells results in a significant increase of cellular ROS level (particularly H2O2) up to 129.54% in comparison with the untreated group (by normalized to 100%).
Abbreviations: PTZ, 10H-3,6-diazaphenothiazine; ROS, reactive oxygen species.
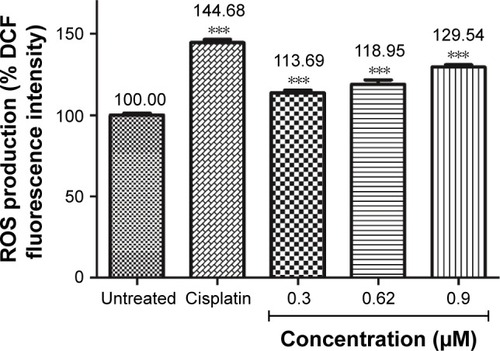
Figure 8 Mitochondrial membrane potential (ΔΨm) of A2780 cancer cells after treated with PTZ was accessed via JC-1 staining assay, with (A) untreated control, (B) cisplatin, (C) 0.30 µM, (D) 0.62 µM, and (E) 0.90 µM.
Abbreviation: PTZ, 10H-3,6-diazaphenothiazine.
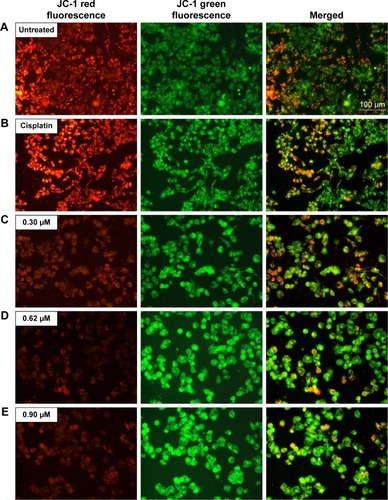
Figure 9 Graphical data representing measurement of (A) caspase-3/7, (B) caspase-8, and (C) caspase-9 activities (in percentage) of A2780 cells after induction of apoptosis by PTZ at three reference concentrations.
Abbreviations: FITC, fluorescein isothiocyanate; PTZ, 10H-3,6-diazaphenothiazine.
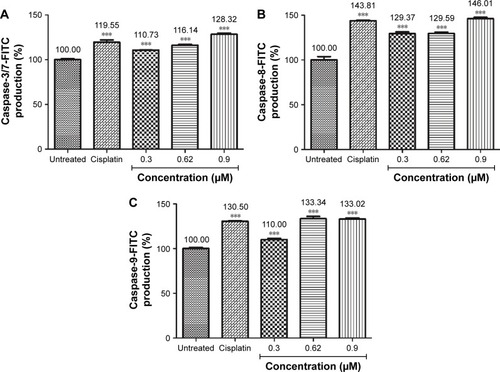
Table 1 RT2 profiler PCR Array analysis on apoptosis pathway
Figure 10 The histogram representing cell cycle phase analysis on A2780 cells after treated by PTZ for 24 hours.
Abbreviation: PTZ, 10H-3,6-diazaphenothiazine.
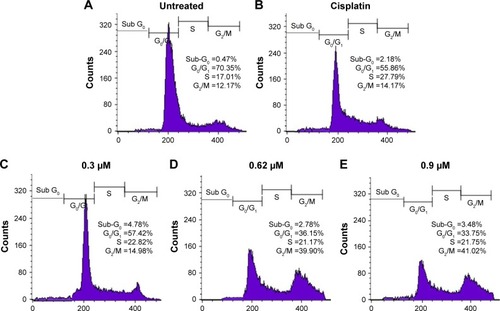
Figure 11 (A) Microscopic images of invaded A2780 cancer cells through the Matrigel™ invasion chamber. By normalizing the invasion rate of cancer cells in untreated control as 100%, application of cisplatin and PTZ exhibited suppression of cancer cells invasion. Photos were taken at a magnification of 200× and each image are representative of three independent experiments. (B) Graphical representation of percentage of invaded cells per microscopic views. The number of invaded cells were calculated by using the cell counter from five random microscopic field under the same microscopic view. ***Indicates results were significantly different to untreated control (0 µM) at p<0.05.
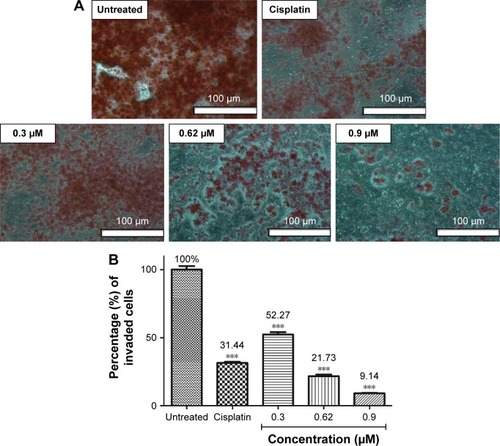
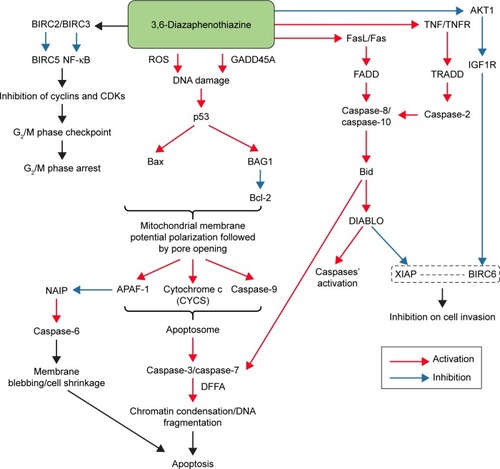
Figure 12 Proposed apoptosis signaling pathways induced by PTZ in A2780 ovarian cancer cells, based on the findings in the RT2 Profiler PCR array (apoptosis pathway).
Abbreviations: CDK, cyclin-dependent kinase; DFFA, DNA fragmentation factor subunit alpha; PTZ, 10H-3,6-diazaphenothiazine; ROS, reactive oxygen species; TNF, tumor necrosis factor; TNFR, TNF receptor; FADD, Fas-associated death domain; TRADD, TNF-associated death domain.