Figures & data
Figure 1 Mean serum tenofovir concentration–time profiles after a single oral administration of tenofovir disoproxil orotate (DA-2802 319 mg) or fumarate (TDF 300 mg) up to 72 hours post-dose (N=32) in linear scale. The inset shows the profile in semilog scale.
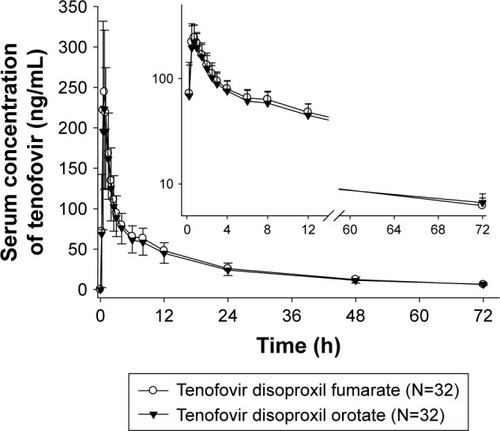
Figure 2 Individual serum tenofovir concentration–time profiles for (left) tenofovir disoproxil orotate (DA-2802 319 mg) and (right) fumarate (TDF 300 mg) up to 12 hours post-dosing after a single oral administration in linear scale (N=32).
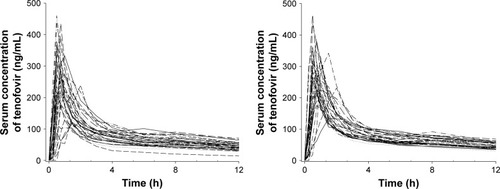
Table 1 Pharmacokinetic parameters of tenofovir and statistical comparison between tenofovir disoproxil orotate (DA-2802 319 mg) and fumarate (TDF 300 mg) after a single oral administration
Figure 3 The tenofovir Cmax (A) and AUC0–t (B) after a single oral administration of tenofovir disoproxil orotate (DA-2802 319 mg) or fumarate (TDF 300 mg). Box plots show median values (solid horizontal lines across the boxes), 50th percentile values (solid horizontal box outline), 90th percentile values (whiskers), and individual values (closed circles).
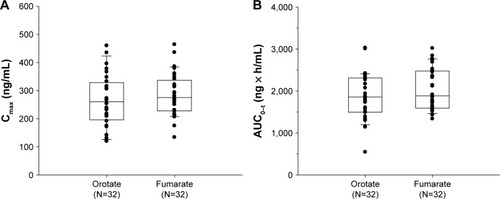
Figure S1 Spaghetti plots of individual (left) Cmax and (right) AUC0–t for comparison between tenofovir disoproxil orotate (DA-2802 319 mg) and fumarate (TDF 300 mg).
Abbreviations: Cmax, maximum concentration; AUC0–t, area under the concentration-time curve to the last quantifiable concentration.