Figures & data
Figure 1 Morphology and immunofluorescence in RCECs.
Notes: RCECs from rat retinal microvascular fragments were cultured in Endothelial Cell Medium. The RCECs fully released and migrated from the capillary fragments after culturing for 5 days (A). After 10 days, the cells showed a short fusiform or round morphology and formed contact-inhibited confluent monolayers with typical cobblestone morphology (B). The RCECs were positive for both CD31 (C, green fluorescence) and vWf (D, green fluorescence), as determined by an immunofluorescent assay. All nuclei were stained with DAPI (blue fluorescence). Magnification ×200.
Abbreviations: DAPI, 4′,6-diamidino-2-phenylindole; RCECs, retinal capillary endothelial cells; vWf, von Willebrand factor.
Abbreviations: DAPI, 4′,6-diamidino-2-phenylindole; RCECs, retinal capillary endothelial cells; vWf, von Willebrand factor.
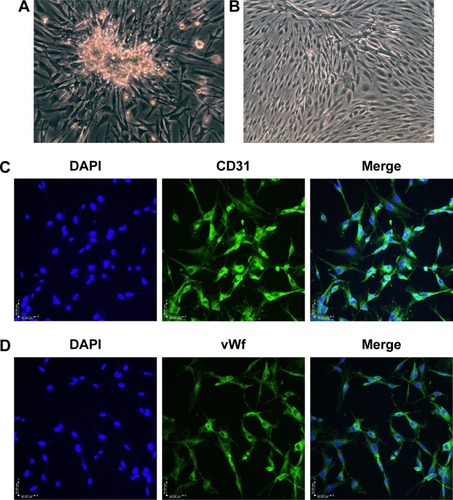
Figure 2 Protection of NR1 from high glucose-induced cytotoxicity.
Notes: Rat RCECs were incubated with varying concentrations of NR1 (1, 5, 10 and 20 μM) in 30 mM glucose. The medium containing 5.5 mM glucose was used as a control. After culturing for 24, 48 or 72 h, MTT was used to examine cell viability. The MTT assay showed that 5, 10 and 20 μM NR1 increased cell viability after 48 and 72 h (A). After culturing for 72 h, LDH release and trypan blue staining assays were performed to examine cell cytotoxicity. The LDH assay showed that 10 μM NR1 significantly decreased the cellular LDH release (B). The trypan blue assay showed that 10 μM NR1 increased the live cell count in rat RCECs (C). Data are expressed as the mean ± SD (n=3). ##P<0.01 versus 5.5 mM glucose; **P<0.01 and *P<0.05 versus 30 mM glucose.
Abbreviations: LDH, lactate dehydrogenase; NR1, Notoginsenoside R1; RCECs, retinal capillary endothelial cells.
Abbreviations: LDH, lactate dehydrogenase; NR1, Notoginsenoside R1; RCECs, retinal capillary endothelial cells.
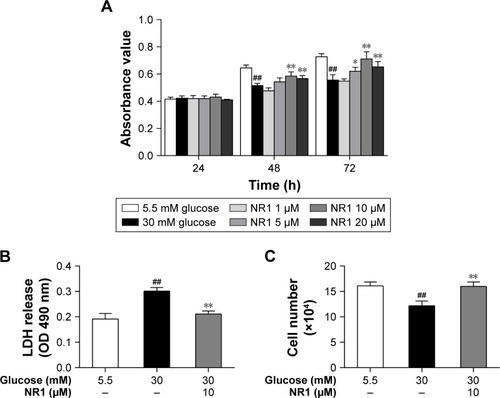
Figure 3 NR1 attenuated high glucose-induced endothelial damage in rat RCECs.
Notes: Rat RCECs were incubated with 10 μM NR1 in 30 mM glucose for 72 h. The medium containing 5.5 mM glucose was used as a control. The apoptotic cells (double labeled with annexin V/PI) were observed by confocal laser scanning microscopy and the relative mtDNA copy number was measured by real-time quantitative PCR. Annexin/PI staining demonstrated that the addition of NR1 decreased the number of apoptotic cells (A). Real-time PCR revealed that NR1 ameliorated high glucose-induced mtDNA damage (B). Data are expressed as the mean ± SD (n=3). ##P<0.01 versus 5.5 mM glucose; **P<0.01 versus 30 mM glucose. Scale bar: 33 μm.
Abbreviations: BF, bright field; mtDNA, mitochondrial DNA; NR1, Notoginsenoside R1; PCR, polymerase chain reaction; PI, propidium iodide; RCECs, retinal capillary endothelial cells.
Abbreviations: BF, bright field; mtDNA, mitochondrial DNA; NR1, Notoginsenoside R1; PCR, polymerase chain reaction; PI, propidium iodide; RCECs, retinal capillary endothelial cells.
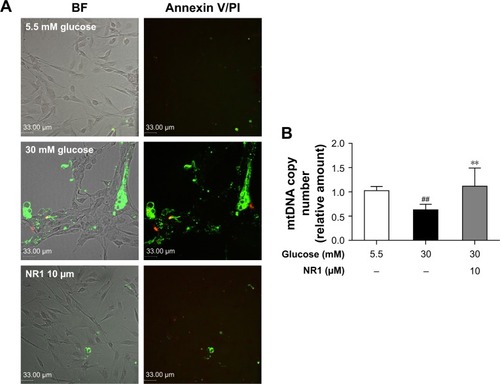
Figure 4 NR1 decreased ROS and 3-NT levels in rat RCECs under high glucose conditions.
Notes: RCECs were incubated with 10 μM NR1 in 30 mM glucose for 72 h. The medium containing 5.5 mM glucose was used as a control. ROS were detected with Amplite™ ROS Red, while immunofluorescence was used to quantify the expression of 3-NT, a specific marker of peroxynitrite (ONOO−). Supplementation with NR1 (10 μM) led to a significant reduction in ROS production (A). Confocal microscopy showed that NR1 reduced the 3-NT staining intensity (B). Fluorescence images were analyzed using Image-Pro Plus 6.0 software (C). Data are expressed as the mean ± SD (n=3). ##P<0.01 versus 5.5 mM glucose; **P<0.01 versus 30 mM glucose. Scale bar: 40 μm.
Abbreviations: 3-NT, 3-nitrotyrosine; DAPI, 4′,6-diamidino-2-phenylindole; NR1, Notoginsenoside R1; RCECs, retinal capillary endothelial cells; ROS, reactive oxygen species; RFU, relative fluorescence unit.
Abbreviations: 3-NT, 3-nitrotyrosine; DAPI, 4′,6-diamidino-2-phenylindole; NR1, Notoginsenoside R1; RCECs, retinal capillary endothelial cells; ROS, reactive oxygen species; RFU, relative fluorescence unit.
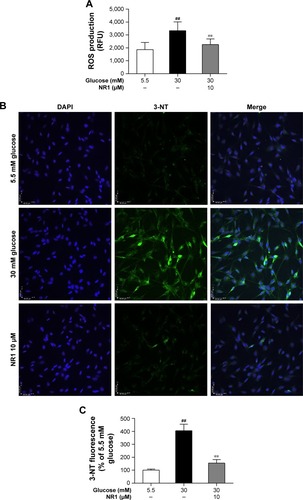
Figure 5 NR1 inhibited NOX and PARP activities, but increased CAT activity under high glucose conditions.
Notes: Rat RCECs were incubated with 10 μM NR1 in 30 mM glucose for 72 h. The medium containing 5.5 mM glucose was used as a control. Cells were collected to examine NOX, CAT and PARP activities. Treatment with NR1 (10 μM) significantly inhibited the activities of NOX and PARP, but increased the activity of CAT (A–C). Data are expressed as the mean ± SD (n=3). ##P<0.01 versus 5.5 mM glucose; **P<0.01 versus 30 mM glucose.
Abbreviations: CAT, catalase; NOX, NADPH oxidase; NR1, Notoginsenoside R1; PARP, poly-ADP (ribose) polymerase; RCECs, retinal capillary endothelial cells; FLU, relative light unit.
Abbreviations: CAT, catalase; NOX, NADPH oxidase; NR1, Notoginsenoside R1; PARP, poly-ADP (ribose) polymerase; RCECs, retinal capillary endothelial cells; FLU, relative light unit.
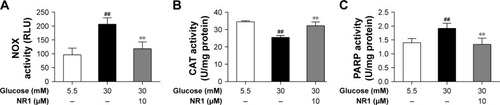
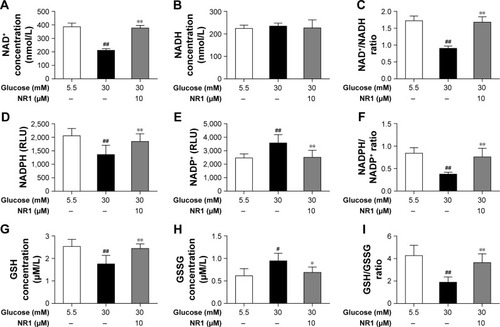
Figure 6 NR1, an intracellular redox modulator, is useful under high glucose conditions when the intracellular redox status is impaired.
Notes: RCECs were incubated with 10 μM NR1 in 30 mM glucose for 72 h. The medium containing 5.5 mM glucose was used as a control. High glucose induced excess ROS production that impaired the antioxidant system and thereby disturbed redox homeostasis. This phenomenon subsequently led to imbalance in NAD+/NADH and NADPH/NADP+ ratios, promoted GSH oxidation and attenuated GSSG reduction. Treatment with NR1 increased the ratios of NAD+/NADH and NADPH/NADP+ in rat RCECs (A–F). In parallel, NR1 administration increased the GSH/GSSG ratio, which improved the redox status (G–I). Data are expressed as the mean ± SD (n=3). ##P<0.01 and #P<0.05 versus 5.5 mM glucose; **P<0.01 and *P<0.05 versus 30 mM glucose.
Abbreviations: GSH, glutathione; NAD+, nicotinamide adenine dinucleotide+; NR1, Notoginsenoside R1; RCECs, retinal capillary endothelial cells; ROS, reactive oxygen species.
Abbreviations: GSH, glutathione; NAD+, nicotinamide adenine dinucleotide+; NR1, Notoginsenoside R1; RCECs, retinal capillary endothelial cells; ROS, reactive oxygen species.