
Figures & data
Table 1 Experimental design matrix and corresponding responses
Table 2 Physical properties of powder mixtures and buccal tablets with different polymer types
Table 3 ANOVA results for response R1
Table 4 ANOVA results for response R2
Table 5 ANOVA results for response R3
Figure 1 3D response surface plots for (A) R1 (TH), (B) R2 (RT), and (C) R3 (DF) as a function of SA and CP weight ratios (%).
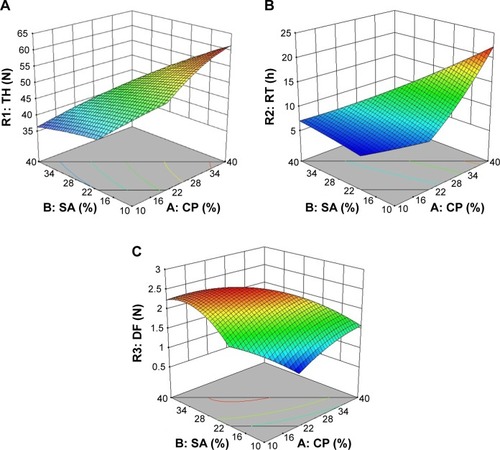
Figure 2 FT-IR spectra of RIS, CP, SA, LM, and buccal tablet.
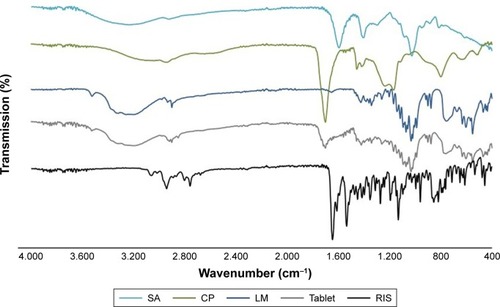
Figure 3 DSC thermograms of RIS, CP, SA, LM, and buccal tablet.
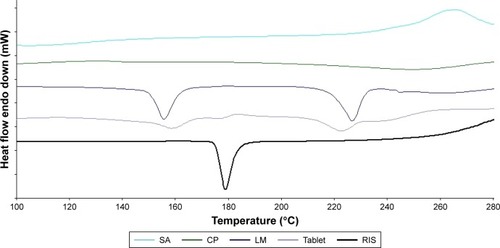
Figure 4 (A) In vitro release profile of RIS from buccal tablets. (B) Swelling index profile of buccal tablets. (C) Images of buccal tablets during swelling studies.
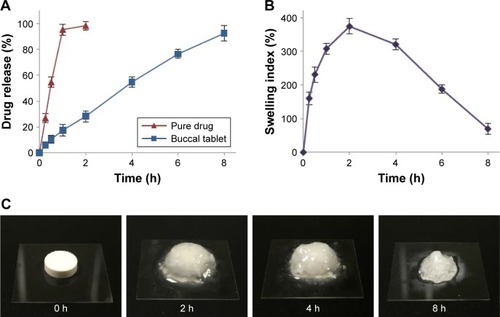
Table 6 In vitro release kinetics of RIS from optimized buccal tablets