
Figures & data
Table 1 Overview of the study design
Table 2 Summary of the PK parameters after the oral administration of a single MB12066 dose
Figure 1 Mean plasma concentration–time profiles after the oral administration of a single dose of MB12066 from predose to 72 hours postdose (left panel: log-linear scale; right panel: linear scale).
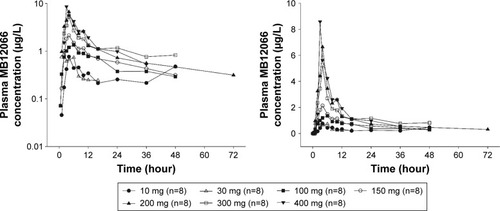
Figure 2 Relationship between individual (A) Cmax or (B) AUClast and doses after a single administration of MB12066.
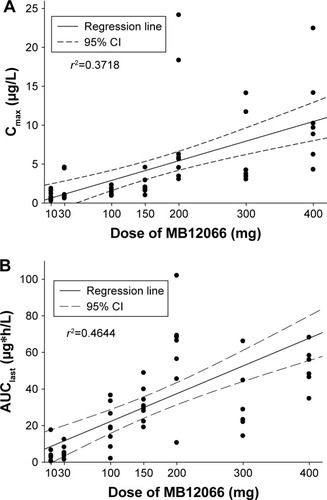
Table 3 Summary of the PK parameters after multiple oral administrations of MB12066 (days 1 and 7 [steady state])
Figure 3 Mean plasma concentration–time profiles after the oral administration of multiple doses of MB12066 from predose to 96 hours after the last dose (left panel: log-linear scale; right panel: linear scale).
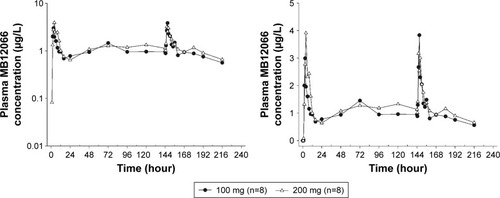
Table 4 Summary of dose-normalized PK parameters stratified by NQO1 genotype