Figures & data
Figure 1 Synthesis route and 1H-NMR spectroscopy of PAA-ss-OA.
Abbreviations: 1H-NMR, hydrogen-1 nuclear magnetic resonance; DMSO, dimethyl sulfoxide; EDC, 1-ethyl-3-(3-dimethylaminopropyl) carbodiimide; NHS, N-hydroxysuccinimide; OA, oleic acid; PAA, poly(acrylic acid); ss, cystamine.
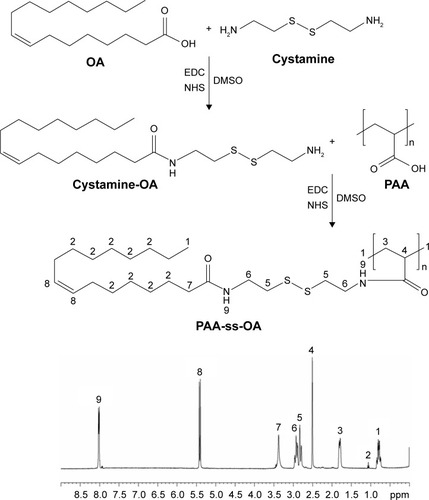
Figure 2 Scheme graph of PAA-ETB-NPs.
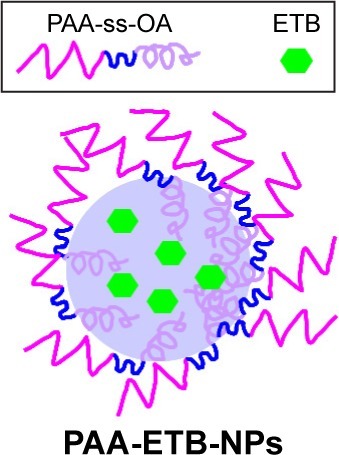
Table 1 Characterization of NPs
Figure 3 The serum stability of NPs in tumor-bearing mouse plasma at 37°C for 72 hours.
Abbreviations: EE, drug encapsulation efficiency; ETB, erlotinib; NPs, nanoparticles; PAA, poly(acrylic acid); PDI, polydispersity index.
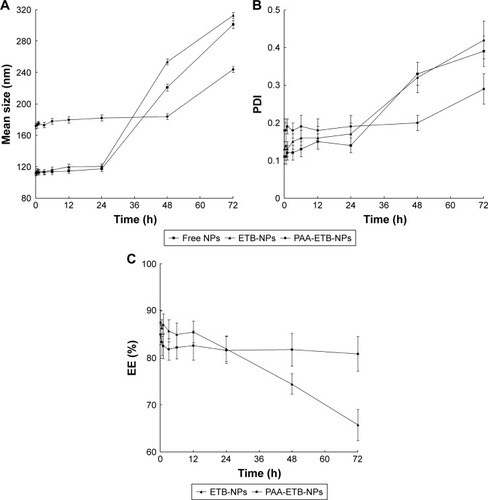
Figure 4 In vitro drug release of ETB from the NPs and solution in PBS (A) and GSH-containing PBS (B).
Abbreviations: ETB, erlotinib; GSH, glutathione; NPs, nanoparticles.
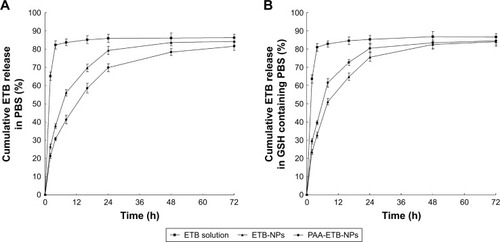
Table 2 IC50 values (μM) of NPs and solution evaluated on A549 cells, NCI-H460 cells, and HUVEC
Figure 5 In vitro cytotoxicity of NPs evaluated on A549 cells (A), NCI-H460 cells (B), and HUVEC (C) by MTT assay.
Abbreviations: ETB, erlotinib; HUVEC, human umbilical vein endothelial cell; MTT, 3-(4,5-dimethylthiazol-2-yl)-2,5-diphenyltetrazolium bromide; NPs, nanoparticles; PAA, poly(acrylic acid).
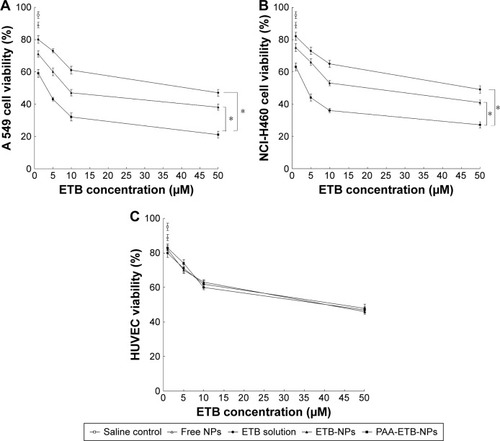
Figure 6 In vivo tissue distribution of ETB solution (A), ETB-NPs (B), and PAA-ETB-NPs (C).
Abbreviations: ETB, erlotinib; NPs, nanoparticles; PAA, poly(acrylic acid).
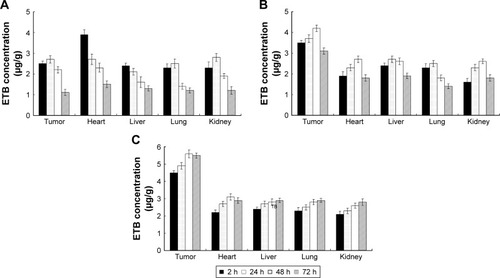
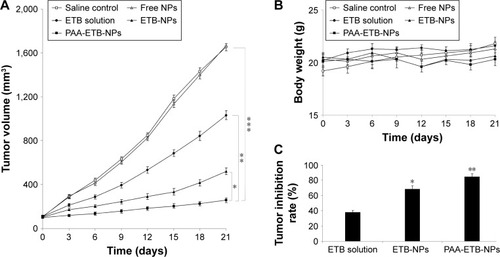
Figure 7 In vivo tumor inhibition effect evaluated by using a xenograft nude mouse model with human lung cancer cells. Tumor volume (A); body weight (B); and tumor inhibition rate (C).
Abbreviations: ETB, erlotinib; NPs, nanoparticles; PAA, poly(acrylic acid).