
Figures & data
Figure 1 Structures of the target compound ortho-F-celecoxib 1, the reported celecoxib, fluorolabeled celecoxib 2, 3, and other tagged NSAID analogs.
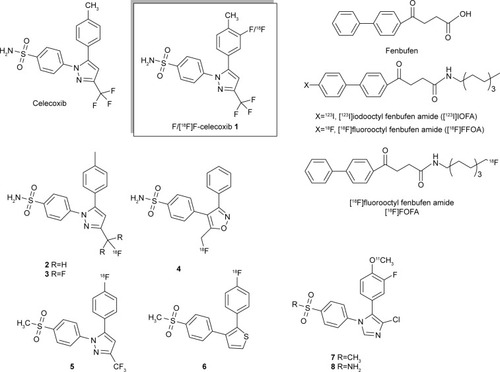
Figure 2 (A) Preparation of ortho-F-1. (B) The less reactive CF3COOF was formed as the major fluorinating reagent.
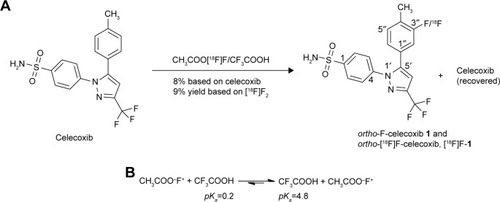
Figure 3 The product mixtures obtained from the radiofluorination of ortho-[18F]F-1 were profiled using high-performance liquid chromatography as shown in the UV− (A) and radiochromatograms (B).
![Figure 3 The product mixtures obtained from the radiofluorination of ortho-[18F]F-1 were profiled using high-performance liquid chromatography as shown in the UV− (A) and radiochromatograms (B).](/cms/asset/b3378677-57d1-4a76-a74d-fb310481b7a8/dddt_a_12181707_f0003_c.jpg)
Table 1 Binding data obtained from this study and the literature
Figure 4 Plots of the formation of [18F]F–ligand–COX, ortho-[18F]F-1, in the presence of various concentrations of the competitor celecoxib (A and B).
![Figure 4 Plots of the formation of [18F]F–ligand–COX, ortho-[18F]F-1, in the presence of various concentrations of the competitor celecoxib (A and B).](/cms/asset/c65f05da-ac7c-4c88-b48d-f746d5740c1a/dddt_a_12181707_f0004_b.jpg)
Figure 5 Tracer uptake of ortho-[18F]F-1 in the COX-2-overexpressed murine CCA tumor cells and the murine CCA tumor cells as a control.
![Figure 5 Tracer uptake of ortho-[18F]F-1 in the COX-2-overexpressed murine CCA tumor cells and the murine CCA tumor cells as a control.](/cms/asset/b7882d9b-e97b-4911-ac7d-a4c40d9d945f/dddt_a_12181707_f0005_c.jpg)
Figure 6 Competitive inhibition of the tracer accumulation (ortho-[18F]F-1) in the presence of various concentrations of celecoxib (0.05 nM–250 μM).
Abbreviations: CCA, cholangiocarcinoma; COX, cyclooxygenase.
![Figure 6 Competitive inhibition of the tracer accumulation (ortho-[18F]F-1) in the presence of various concentrations of celecoxib (0.05 nM–250 μM).](/cms/asset/0799cc7f-339e-4de5-8938-29400805d2df/dddt_a_12181707_f0006_b.jpg)
Figure 7 (A) Selected PET images taken of two F18-tagged ligands in the same.
Abbreviations: CCA, cholangiocarcinoma; PET, positron emission tomography; ROIs, regions of interest.
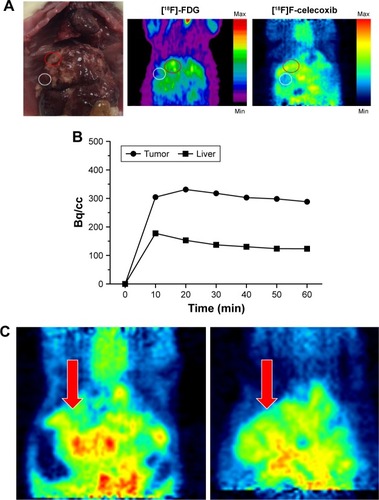
Table 2 Comparison between the blocking studies of CCA rats and normal rats in the presence of a competitor, celecoxib, at various doses
Figure 8 A representative comparison between the static PET images of ortho-[18F] F-1 in a CCA rat (left) and in the same rat using cold celecoxib (2 mg) as a blocker (right).
Abbreviations: CCA, cholangiocarcinoma; PET, positron emission tomography.
![Figure 8 A representative comparison between the static PET images of ortho-[18F] F-1 in a CCA rat (left) and in the same rat using cold celecoxib (2 mg) as a blocker (right).](/cms/asset/f25013f1-1229-4015-92b6-13478c05819c/dddt_a_12181707_f0008_c.jpg)
Figure 9 The dose–response curve for the CCA rats in the presence of the competitor celecoxib.
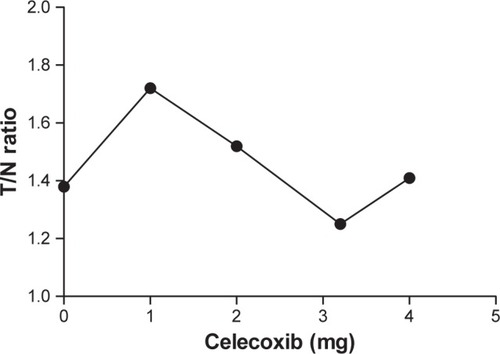
Figure 10 Comparison between the tracer uptake of ortho-[18F]F-1 in the tumor lesion of CCA rats (n=5) and normal liver region of the rats including CCA rats (n=13), P=0.0021, one-tailed Student’s t-test. **The statistical variation is p<0.005.
![Figure 10 Comparison between the tracer uptake of ortho-[18F]F-1 in the tumor lesion of CCA rats (n=5) and normal liver region of the rats including CCA rats (n=13), P=0.0021, one-tailed Student’s t-test. **The statistical variation is p<0.005.](/cms/asset/8592de8d-a294-4cff-ac10-14ece84ed483/dddt_a_12181707_f0010_b.jpg)