Figures & data
Figure 1 Miconazole promotes protein expression of NRF2 in bladder cancer cells. (A and B; upper panels) T24 and 5637 BC cells were treated with increased concentrations of miconazole for 24 h, total proteins were extracted and expression levels of NRF2 were detected by Western blot. (A and B; lower panels) The relative band intensities of proteins presented in (A and B) were quantitated by densitometric scanning and are presented as the fold of control group; and the statistical calculation from blots more than three independent experiments are shown (n=4). The results are presented as the means ± S.D. *P<0.05 compared with Con. group.
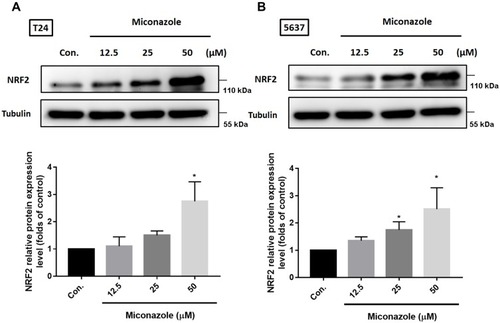
Figure 2 Miconazole stimulates noncanonical p62-KEAP1 pathway in bladder cancer cells. (A and B; upper panels) T24 and 5637 BC cells were treated with increased concentrations of miconazole for 24 h, total proteins were extracted and expression levels of p62 and KEAP1 were detected by Western blot. (A and B; lower panels) The relative band intensities of proteins presented in (A and B) were quantitated by densitometric scanning and are presented as the fold of control group; and the statistical calculation from blots more than three independent experiments are shown (n=4). The results are presented as the means ± S.D. *P<0.05 compared with Con. group.
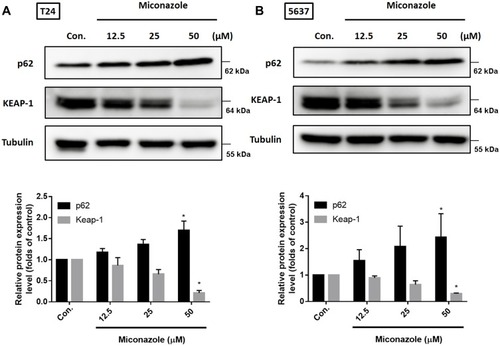
Figure 3 Miconazole activates p62-KEAP1-NRF2 pathway in a time-dependent manner in bladder cancer cells. (A and B; upper panels) T24 and 5637 BC cells were treated with the increased time course of miconazole (25 μM), total proteins were extracted and expression levels of p62, KEAP1 and NRF2 were detected by Western blot. (C; upper panel) T24 BC cells were transfected with p62 siRNA or negative control siRNA for 24 h, followed by treated with miconazole (25 μM) for further 24 hrs, and expression levels of p62 and NRF2 were evaluated by Western blot. (A–C; lower panels) The relative band intensities of proteins presented in (A–C) were quantitated by densitometric scanning and are presented as the fold of control group; and the statistical calculation from blots of three independent experiments are shown (n=3). The results are presented as the means ± S.D; *P<0.05 compared with Con.; #P<0.05 compared with the miconazole treatment group.
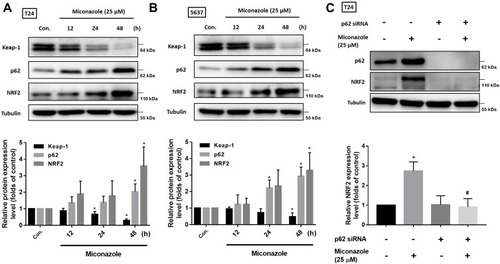
Figure 4 Miconazole promotes NRF2 nuclear translocation in bladder cancer cells. (A and B) T24 and 5637 bladder cancer cells were treated with increased concentrations of miconazole for 24 h, then subjected to immunofluorescence staining by anti-p62 and -NRF2 antibodies. Nuclei were counterstained with DAPI. Representative microscopy images were shown.
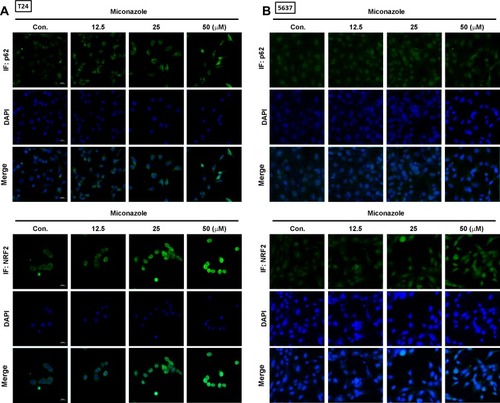
Figure 5 Miconazole increases transcriptional levels of NRF2 and p62 but not KEAP1 in a dose-dependent manner. (A and B) T24 and 5637 bladder cancer cells were treated with different concentrations of miconazole for 24 hrs, total mRNA were extracted from cells, and expression levels of NRF2, p62 and KEAP1 were detected by qPCR. Results are expressed as the mean ± S.D of triplicate samples (n=6). *P < 0.05 compared to the Con. group.
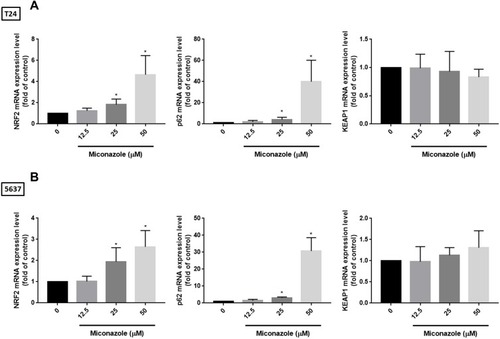
Figure 6 Miconazole increases transcriptional levels of NRF2 and p62 but not KEAP1 in a time-course investigation. (A and B) T24 and 5637 bladder cancer cells were treated with 25 μM of miconazole for 0 hrs, 12 hrs, 24 hrs and 48 hrs, total mRNA were extracted from cells, and expression levels of NRF2, p62 and KEAP1 were detected by qPCR. Results are expressed as the mean ± S.D of triplicate samples (n=6). *P < 0.05 compared to the Con. group.
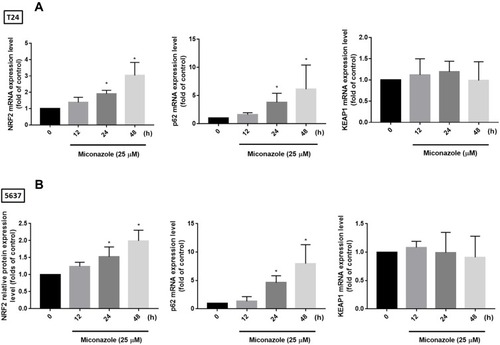
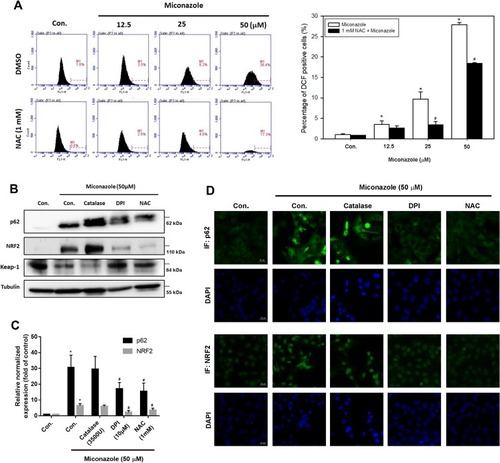
Figure 7 ROS scavengers reverse p62-KEAP1-NRF2 pathway activation in bladder cancer cells. (A) T24 cells were pretreated with or without ROS scavenger NAC (1mM) for 1 hr, followed by incubated with different concentrations of miconazole for 24 hrs. The cells were stained with ROS detection probe, then subjected to flow cytometry to analyze ROS generation. The quantification of relative intensity was shown in the lower panel. (B and C) T24 cells were pretreated with different ROS scavengers (catalase, an H2O2 scavenger, 3500 U; DPI, a NOX-specific inhibitor, 10 μM; NAC, a general ROS scavenger, 1 mM) for 1 hr followed by treated with miconazole (25 μM) for 24 hrs. The protein and mRNA expression of p62, NRF2 and KEAP1 were evaluated by Western and qPCR. (D) T24 cells were pretreated as described above, then immunofluorescence staining was performed with anti-p62 and -NRF2 antibodies. Nuclei were counterstained with DAPI. Representative microscopy images were shown. Results are expressed as the mean ± S.D of triplicate samples (n=5). *P<0.05 compared with Con.; #P<0.05 compared with the miconazole treatment group.