Figures & data
Table 1 Predicted Lung Cancer-Related Targets of Dioscin
Figure 1 Analysis of dioscin compound-target network. (A) The overlapped targets of lung cancer and dioscin-related targets were analyzed by STRING to generate the compound-target network. The diameter of the nodes was determined by the degree of freedom. The larger the diameter, the more critical the node is in the network. (B) GO functional annotation of potential targets of dioscin. Biological processes (BP), Cellular components (CC) and Molecular functions (MF) were ranked according to -logP values. (C) KEGG enrichment analysis for potential targets of dioscin. The top 20 with lower P-value was shown.
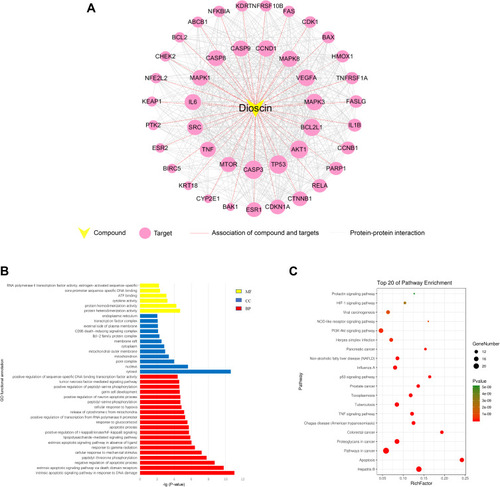
Figure 2 Modeling of dioscin with the potential targets. (A) Dioscin-AKT docking model with predicted binding energy of −8.91 kcal/mol. The Docking model of AKT and the crystal ligand has predicted binding energy of −10.89 kcal/mol. (B) Dioscin-mTOR docking model with predicted binding energy of −9.62 kcal/mol. The Docking model of AKT and the crystal ligand has predicted binding energy of −18.57 kcal/mol.
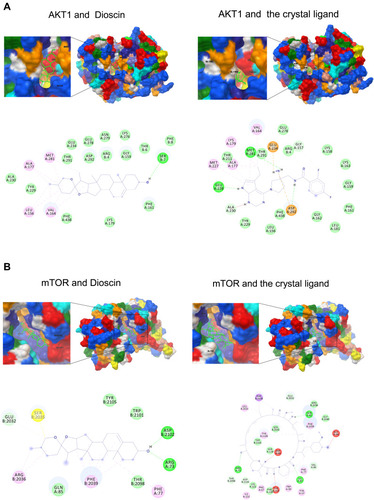
Figure 3 Dioscin inhibited the proliferation, migration, and invasion of A549 and H1299 cells. (A) The cell viability of A549 and H1299 cells treated with dioscin (1, 2, 4, and 8 µM) for 24 h and 48 h was determined using a Cell Counting Kit 8 assay. The width of scratches was measured in cells treated or not with dioscin, at 0 and 24 h in A549 (B) and H1299 (C) cells. Additionally, using a Transwell migration assay and Matrigel invasion assay, the number of migrated or invaded cells treated with dioscin per chamber was counted and compared with that in the control group from three independent experiments (*p < 0.05; **p< 0.01; ***p< 0.001).
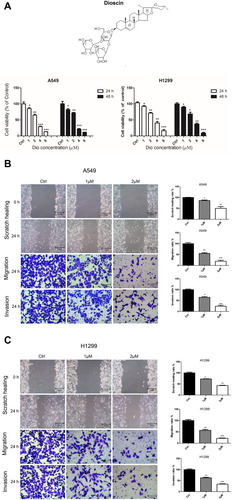
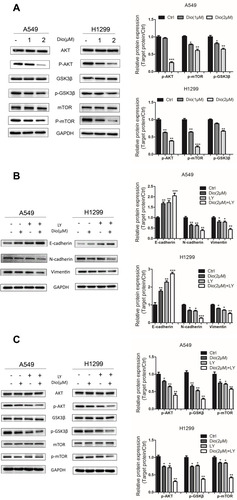
Figure 4 Effect of dioscin on the expression of EMT markers in H1299 and A549 cells. (A) Cells were treated with dioscin (1 and 2 µM) for 24 h, and the EMT-associated biomarkers were detected using Western blotting. Typical graphs and a histogram (mean ± SD) are shown, n = 3. *p < 0.05; **p< 0.01; ***p< 0.001 compared with the control group. (B) After treatment with dioscin (1 and 2 µM) for 24 h, immunofluorescence staining was performed to determined Vimentin and E-cadherin expression in H1299 and A549 cells using confocal microscopy. Blue fluorescence indicates DAPI-labeled nuclei, and Green fluorescence indicates Vimentin or E-cadherin positive expression.
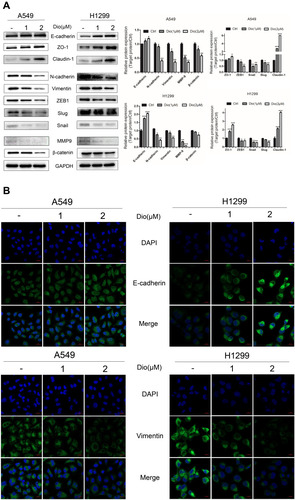
Figure 5 Effects of dioscin on the AKT/GSK3β/mTOR pathway in A549 and H1299 cells. (A) Cells were treated with dioscin (1 and 2 µM) for 24 h. The levels of AKT/GSK3/mTOR related pathway proteins, including phosphorylated (p)-AKT, AKT, p-GSK3, GSK3, p-mTOR, and mTOR, were examined using Western blotting analysis. (B, C) Cells were pre-treated with 10 µM LY294002 (a PI3K/AKT inhibitor, LY) for 2 h and then treated with dioscin (1 or 2 µM) for 24 h. Western blotting was then employed to determine the protein levels of Vimentin, E-cadherin, and N-cadherin (B) and p-AKT, AKT, p-GSK3, GSK3, p-mTOR, and mTOR (C). GAPDH was used as a loading control. Typical graphs and a histogram (mean±SD) are shown, n=3. *p < 0.05; **p< 0.01; ***p< 0.001 compared with the control group.