Figures & data
Figure 1 Chemical structure of berberrubine: Section (A) the methylenedioxyphenyl structure; section (B) the methylated catechol structure.
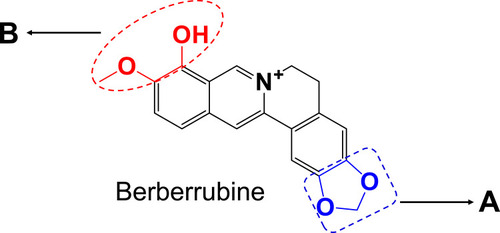
Figure 2 Acute hepatotoxicity in mice: Time-dependent manner of ALT (A) or AST (B), mice were treated with BRB (i.p.) at 50mg/kg (n=6); dose-dependent manner of ALT (C) or AST (D), mice were treated with BRB (i.p.) at 0, 25, 50 or 100mg/kg (n=6); representative histopathology of liver from mice in BRB-treated group at 2 h after administration (E) and control group (F), all processed livers were microscopically (Scale bar=50um) examined.*p < 0.05, **p < 0.01, ***p < 0.001 compared with the control group.
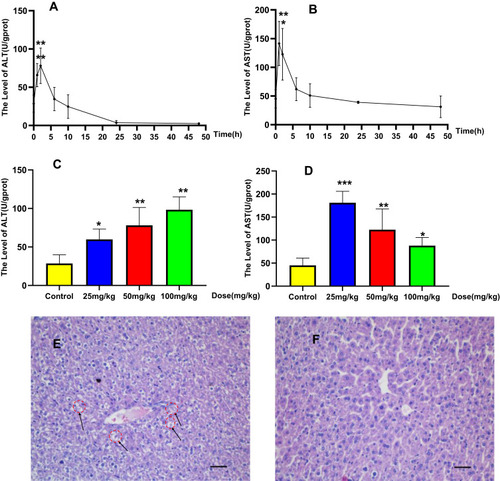
Figure 3 Sub-chronic hepatotoxicity in rats: Time-dependent and dose-dependent manner of ALT (A) or AST (B), rats were treated with BRB (i.g.) at 0, 25, 50, or100mg/kg/d (n=8) for 6 weeks; representative histopathology of liver from rats in BRB-treated group at the sixth week after administration (C) and control group (D), all processed livers were microscopically (Scale bar=50um) examined.*p < 0.05, **p < 0.01 compared with the control group.
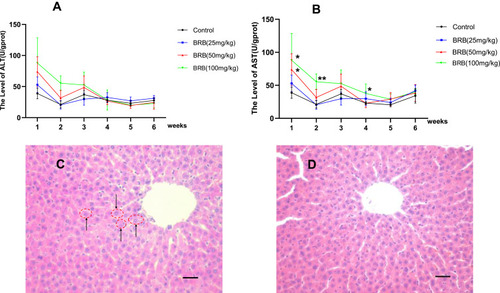
Table 1 Mass Spectrometric Profiles of GSH Adducts Derived from Metabolic Activation of BRB
Figure 4 Identification of metabolite M1: BRB was incubated with mouse liver microsomes fortified with NADPH and GSH at 37 °C for 1h, followed by LC-MS/MS analysis. Extracted ion chromatogram of M1 obtained from LC-Q-TOF/MS analysis of MLM incubations containing BRB and GSH in the absence (A) or presence (B) of NADPH; MS/MS spectrum of M1 (C).
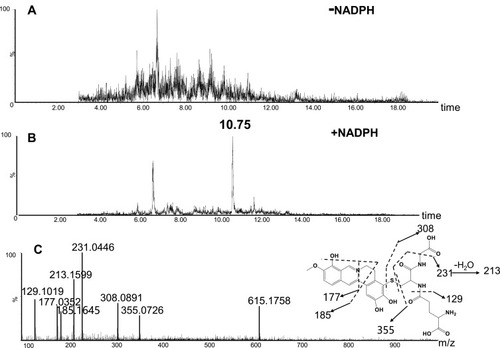
Figure 5 Identification of metabolite M2: BRB was incubated with mouse liver microsomes fortified with NADPH and GSH at 37 °C for 1h, followed by LC-MS/MS analysis. Extracted ion chromatogram of M2 obtained from LC-Q-TOF/MS analysis of MLM incubations containing berberrubine and GSH in the absence (A) or presence (B) of NADPH; MS/MS spectrum of M2 (C).
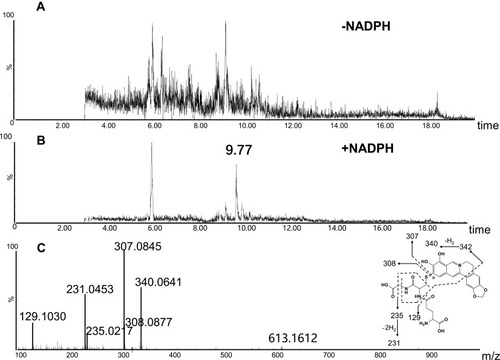
Figure 6 Identification of metabolite M4: BRB was incubated with mouse liver microsomes fortified with NADPH and GSH at 37 °C for 1h, followed by LC-MS/MS analysis. Extracted ion chromatogram of M4 obtained from LC-Q-TOF/MS analysis of MLMincubations containing berberrubine and GSH in the absence (A) or presence (B) of NADPH; MS/MS spectrum of M4 (C).
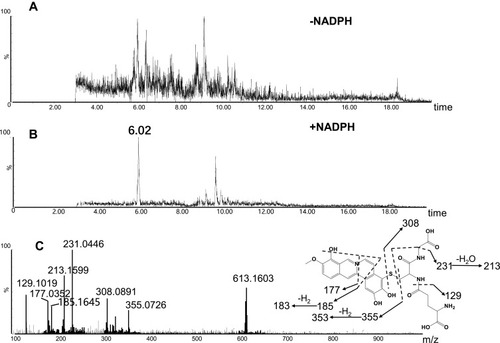
Figure 7 Identification of metabolites M5: BRB was incubated with mouse liver microsomes fortified with NADPH and GSH at 37 °C for 1h, followed by LC-MS/MS analysis. Extracted ion chromatogram of M5 obtained from LC-Q-TOF/MS analysis of MLM incubations containing berberrubine and GSH in the absence (A) or presence (B) of NADPH; MS/MS spectrum of M5 (C).
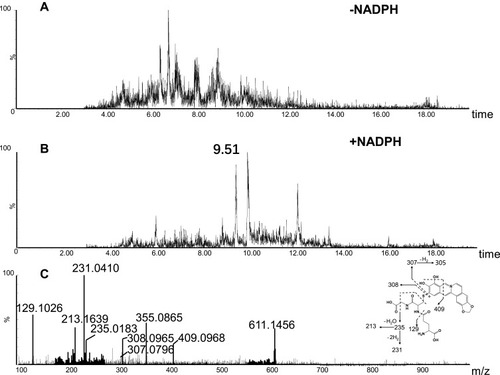
Table 2 Mass Spectrometric Profiles of Cys-Based Adducts of BRB in Liver Tissues After Exhaustive Proteolytic Digestion
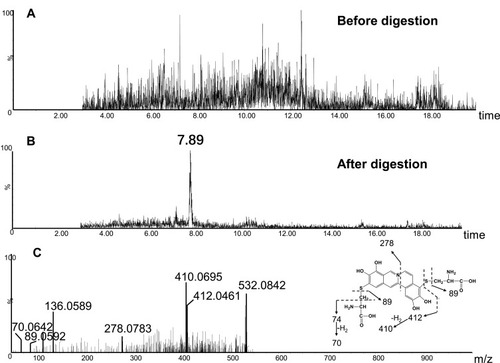
Figure 8 Identification of metabolites A1: BRB-treated mouse liver homogenates were proteolytically digested, followed by LC-MS/MS analysis. Extracted ion chromatogram of A1 obtained from LC-Q-TOF/MS before (A) or after exhaustive proteolytic digestion (B); MS/MS spectrum of A1 (C).
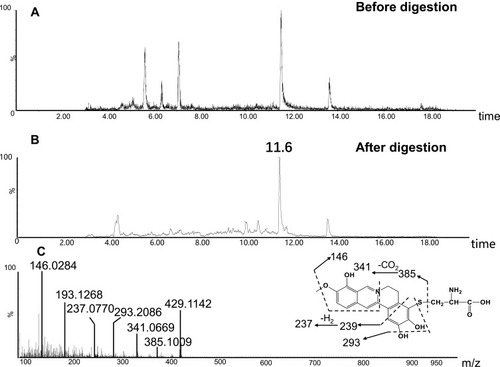
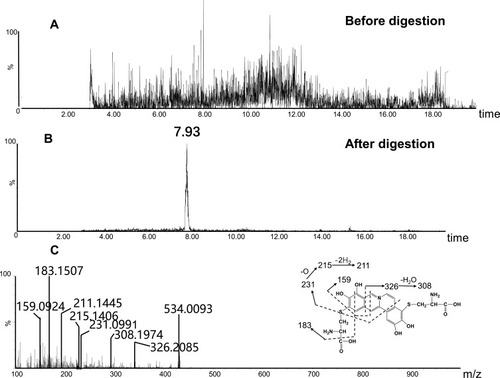
Figure 9 Identification of metabolites A3: BRB-treated mouse liver homogenates were proteolytically digested, followed by LC-MS/MS analysis. Extracted ion chromatogram of A3 obtained from LC-Q-TOF/MS before (A) or after exhaustive proteolytic digestion (B); MS/MS spectrum of A3 (C).
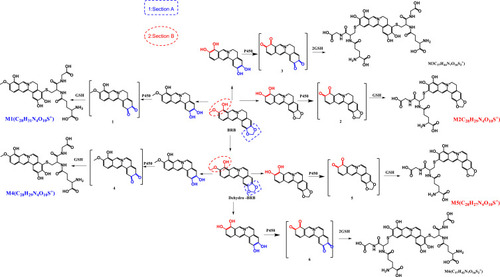
Scheme 1 Proposed metabolic activation pathways of BRB (M1-M6).
Scheme 2 Proposed pathways of protein and amino acid adduct formation as a result of BRB metabolism (A1-A6).
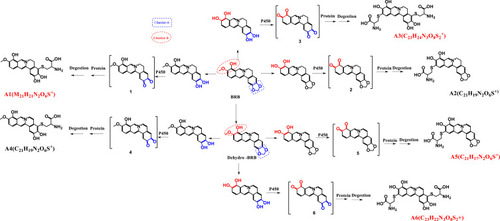
Figure 10 Identification of metabolites A5: BRB-treated mouse liver homogenates were proteolytically digested, followed by LC-MS/MS analysis. Extracted ion chromatogram of A5 obtained from LC-Q-TOF/MS before (A) or after exhaustive proteolytic digestion (B); MS/MS spectrum of A5 (C).
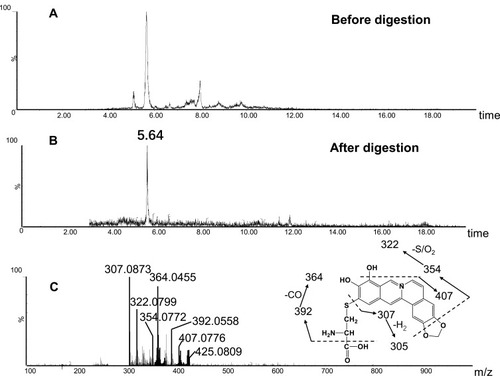
Figure 11 Identification of metabolites A6: BRB-treated mouse liver homogenates were proteolytically digested, followed by LC-MS/MS analysis. Extracted ion chromatogram of A6 obtained from LC-Q-TOF/MS before (A) or after exhaustive proteolytic digestion (B); MS/MS spectrum of A6 (C).